Some important topics to cover when discussing Coulombic Efficiency (CE) are: what CE measurements mean and how they can be used to quantify cell performance; how to fairly compare cells cycled at different rates or within different voltage intervals by normalizing for cycle time – giving the Coulombic Inefficiency per hour (CIE/hr); and capacity fade.
CE and CIE/hr can be used to quantify cell degradation in significantly less time than traditional long-term cycling tests. But understanding why the CE of a cell is worse than another is crucial to the cell development cycle. This is where measurements must also include charge endpoint capacity slippage.
What is Charge Endpoint Capacity Slippage?
Charge endpoint capacity slippage captures how much capacity is wasted on processes that do not necessarily cause capacity fade but cause more capacity to be measured during charge compared to discharge. Most of the time cells will have a smaller discharge capacity than charge capacity in the same cycle (CE of less than 1.000000). It isn’t obvious why the subsequent charge capacity of the cell is often greater than that previous discharge capacity. This happens because of charge endpoint capacity slippage, and it’s deeply intertwined with capacity fade to make up the CE of a cell.
In contrast to capacity fade – where Li-ions from the positive electrode (the “lithium inventory”) are consumed in irreversible reactions – charge endpoint capacity slippage is due to other reactions in a Li-ion cell that don’t necessarily consume lithium inventory. Instead, they prevent electrons from being counted during discharge (decreasing the measured capacity) and cause extra electrons to be counted during charge (increasing the measured capacity). It’s important to keep in mind that Li-ion cells are intrinsically complex with many interacting components and that there are many different mechanisms that can lead to charge endpoint capacity slippage.

Imagine we have a bucket with a small hole in it where the charging process is done by pouring water into the bucket and the discharge process is done by pouring the water out of the bucket.
If we measure the charge capacity as the amount of water poured into the bucket, then we are also counting the water that will leak before it is poured out.
Similarly, if we measure the discharge capacity as the amount of water that is poured out, then we are not counting the water that leaked while the water was being poured out.
In this scenario, the water that leaks between the time the bucket is filled and emptied is analogous to charge endpoint capacity slippage because it causes the discharge capacity to be less than the charge capacity.
Interestingly, the total amount of water that has leaked out can be inferred without directly measuring it; simply knowing the amount of water in the bucket before and after it has been filled and emptied indicates how much water has leaked. It’s the same with charge endpoint capacity slippage; it indicates the amount of measured capacity owing to reactions or mechanism that don’t consume lithium inventory.
Now imagine this:
The water was replaced with maple syrup and there was a small amount of crystallization on the walls of the bucket every time it was filled, reducing the available bucket volume and consequently the amount of maple syrup that could be put in the bucket each “cycle”.
The relationship between the amount of syrup leaked and the amount of syrup crystallized is analogous to the relationship between charge endpoint capacity slippage and capacity fade.
A More Detailed Analysis
To understand how charge endpoint capacity slippage arises, we’ll get into a slightly more technical discussion. The capacity of a cell during a particular cycle comes down to counting electrons that move through the cell circuit (measuring current). It’s assumed that in a Li-ion cell, each electron that flows through the cell circuit corresponds to one Li-ion being inserted (or removed) and removed (or inserted) from each electrode – this is the “electrochemical” reaction through which energy is stored or released.
But there are other reactions in a Li-ion cell that skew the balance between electrons flowing through the cell circuit and Li-ions being inserted and removed from electrodes. An example of such a reaction is called ‘electrolyte oxidation’ which, unlike electrolyte reduction, does not consume lithium inventory and instead involves a Li-ion from the electrolyte. This type of reaction typically occurs at the positive electrode surface and manifests differently depending on whether the cell is being charged or discharged. During charge, an electrolyte species can lose an electron to the positive electrode material, becoming positively charged. This causes an electron to flow through the cell circuit and a positively charged Li-ion from the electrolyte to insert into the negative electrode. The cell capacity is apparently increased because this reaction does not involve the removal of a Li-ion from the positive electrode, yet an electron passed through the cell circuit.
In contrast, during discharge an electrolyte species can lose an electron to a positively charged Li-ion from the electrolyte as it’s inserted into the positive electrode. This apparently decreases the discharge capacity because a corresponding electron does not pass through the cell circuit while the voltage of the positive electrode versus lithium changes when a Li-ion is inserted.
In each of the above cases, a Li-ion from the electrolyte is added to the lithium inventory. However, charge endpoint capacity slippage can also arise due to reversible redox shuttle reactions between electrodes, mechanical self-discharge such as dendrite growth through the separator, or cell defects.
In instances like this, electrolyte oxidation (and other mechanisms) can lead to an apparent increase in charge capacity and an apparent decrease in discharge capacity.
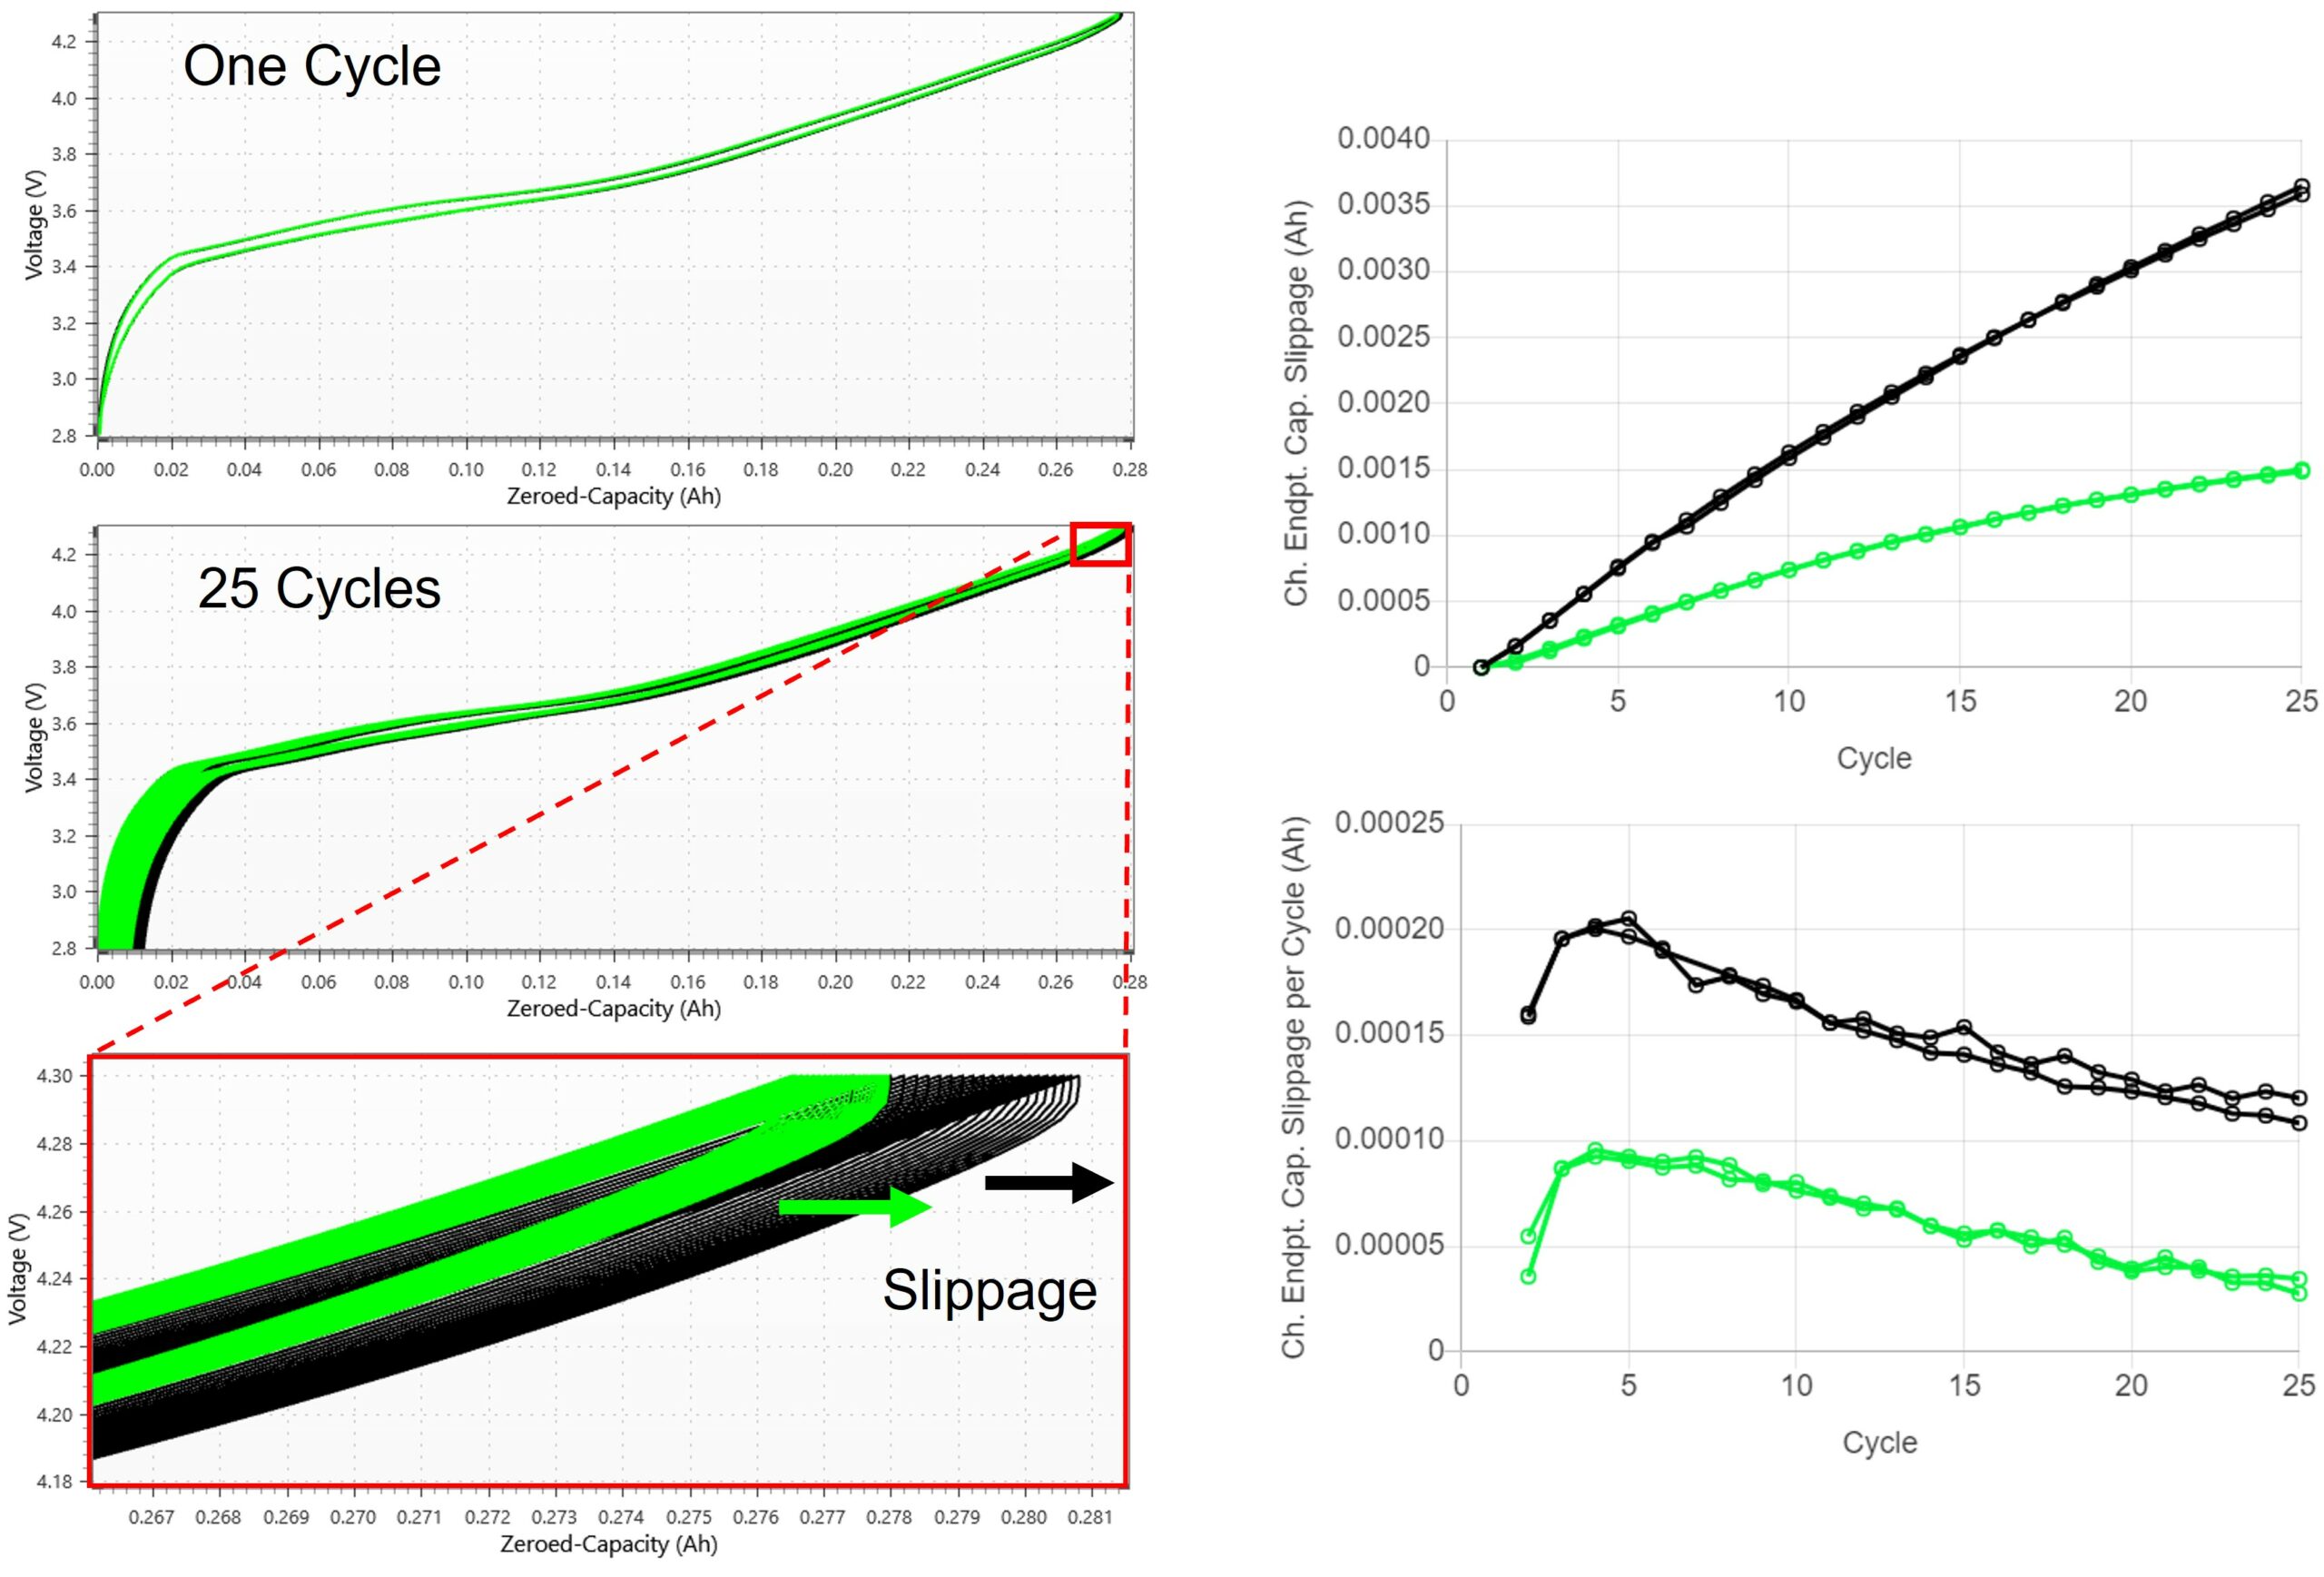
This asymmetric behavior between charge and discharge causes the voltage vs. cumulative capacity curves to shift to the right of each cycle.
The leftmost panel in the figure above shows how the capacity at top of charge slips to the right with cycle number; this is the charge endpoint capacity slippage.
The left-hand panels in the above figure show voltage vs. capacity curves for two sets of pair cells with one set that experiences more charge endpoint capacity slippage than the other. Like capacity fade, charge endpoint capacity slippage can be visualized in two ways:
- the cumulative slippage, shown in the top right panel, picks out the capacity value at top of charge for each cycle relative to the first cycle (I.e., total slippage), and
- the relative slippage, or slippage per cycle, shown in the lower right panel, takes the difference between the capacity value at top of charge of cycle n and cycle n-1.
It’s useful to consider charge endpoint capacity slippage in both ways when comparing cells. Some insight can be gained into both rates of oxidation reactions and the total number of reactions that have taken place.
For example:
Together, capacity fade and charge endpoint capacity slippage compose the CE of a cell. Since different reaction mechanisms give rise to each, it’s important to look at the CE and its components when comparing cells – this information is invaluable to design and choose better cells using an understanding of degradation mechanisms. To compare cells cycled at different rates and/or within different voltage intervals, charge endpoint capacity slippage and capacity fade can be normalized by the cycle time to give the CIE/hr.
Contact us
We’re providing revolutionary clean energy solutions to the battery industry. Discover how we can help you by contacting us today.