The Dahn Research Group at Dalhousie University has been a world leader in lithium-ion battery research for decades. Renowned for pioneering insights into battery longevity, safety, and degradation, the lab has played a major role in researching advanced chemistries including lithium iron phosphate (LFP). With LFP seeing widespread adoption in electric vehicles and stationary storage due to its safety, cost, and cycle life advantages, research that pushes this chemistry’s performance boundaries is more relevant than ever.
Eniko Zsoldos, PhD, a former researcher at the Dahn Lab, recently published a study titled “The Operation Window of Lithium Iron Phosphate/Graphite Cells Affects Their Lifetime” in The Journal of The Electrochemical Society. The study highlights how the chosen operation window during cycling significantly impacts the long-term performance of LFP/graphite cells.
Using ultra-high precision coulometry measurements and various other methods, Eniko and the team demonstrated that the commonly assumed robustness of LFP may not hold under certain operational windows. The findings provide direct insight into how cycling conditions influence degradation rates, helping guide industry best practices for maximizing cell life. Operating their batteries to different states of charge is something that consumers have direct control over, so this research was particularly relevant for consumers wanting to optimize their LFP battery lifetimes in their EVs or home energy storage systems.
The study drew significant attention in the battery science community and beyond; it was recently featured and went viral on the Engineering Explained YouTube channel, which broke down their research in the How to Ruin Your Electric Car’s Battery- LFP Edition! video. Eniko has also presented her work in webinars for the Electrochemical Society, further contributing to knowledge sharing in the field.
Eniko has recently joined the NOVONIX Battery Technology Solutions (BTS) team as a Senior Cell Scientist. In this role, she supports global partners, ranging from startups to major OEMs. She continues to play an impactful role in developing and validating new battery technologies.
The BTS R&D Services team provides advanced cell prototyping and comprehensive electrochemical testing powered by tools like NOVONIX Ultra-High Precision Coulometry (UHPC), which was instrumental in Eniko’s study. The following Q&A dives deeper into how UHPC enabled these insights and how the platform continues to play a role in advancing battery development.
Q: What was the overall motivation behind this study? What led you to investigate the impact of state-of-charge windows on LFP–graphite cells?
This study is commercially relevant, especially for EV owners who regularly charge to 100% but only drive short distances daily. That’s a very common real-world use case.
Academically, our work began with isothermal microcalorimetry to measure parasitic heat flow. While most battery heat during charging comes from Joule heating, we focused on the smaller portion caused by irreversible chemical reactions like SEI (Solid Electrolyte Interphase) growth that damage the cell.
We originally hypothesized that the rate of SEI growth wouldn’t change much across the state of charge (SoC), since graphite’s potential vs lithium stays fairly constant. But surprisingly, we observed significantly more parasitic heat at higher SoC levels, particularly between 70% to 100%.
This led us to test whether that thermal behavior translated into real-world cycle life degradation. We selected LFP/graphite cells to isolate degradation from the graphite side only, since LFP chemistry operates at lower voltage and avoids confounding high-voltage degradation seen in NMC cells.
So, the motivation evolved from a calorimetry-based study into a practical investigation of how SoC impacts cycle life in LFP/graphite cells and the cycling results confirmed that the SoC effect is real and measurable.
Q: What motivated you to incorporate UHPC into this study and how critical was it to detecting some early-stage degradation mechanisms?
UHPC was extremely helpful in this study, especially given the narrow SoC windows we were cycling, like 0–25% (low SoC) and 75–100% (high SoC). In LFP/graphite cells, the voltage profile is very flat, with a nominal voltage around 3.3 V. Because of this, traditional voltage-based cycling doesn’t give you the resolution needed to distinguish between high and low SoC regions.
To overcome that, we used constant-capacity cycling protocols instead of voltage limits. For example, to target the lower SoC range, we charged to a fixed capacity limit of 25% of the cell’s overall capacity, then discharged to a defined lower voltage. This method allowed us to clearly control the SoC window while maintaining the ability to measure differences between charge and discharge capacities.
However, with our regular cyclers, even though they are good for long-term testing, they didn’t provide the resolution we needed for analyzing subtle cycle-to-cycle changes. They only reported the same fixed charge and discharge values each cycle, making it impossible to resolve meaningful differences in capacity fade in such narrow SoC windows. For these lower precision chargers, we relied on full SOC range check-up cycles to understand the capacity fade behaviour.
UHPC stood out by delivering high-resolution data from the very beginning. Even in early cycles, within the first 50 we were able to observe meaningful coulombic efficiency differences and distinguish higher fade rates at higher SoC. This early insight was later confirmed by long-term cycling results, validating UHPC’s ability to reveal degradation trends quickly and accurately.
Q: Did you have any unexpected findings from the UHPC data that maybe you wouldn’t have found in traditional cycling methods?
The coulombic efficiency precision of the UHPC was the standout feature for us. It allowed us to clearly distinguish between the charge and discharge capacities, even within fixed-capacity windows, something that lower-precision cyclers simply couldn’t resolve.
Another major advantage was during check-up cycles. We could observe how the coulombic efficiency shifted during relaxation and track how many cycles it took to recover. The efficiency behavior during these check-up cycles was noticeably different from what we saw in the limited SoC cycling windows.
This difference is largely due to the graphite overhang, which is typically about 1 mm larger in geometric area compared to the cathode. When cycling in the higher SoC window (75–100%), that overhang region of the graphite becomes more lithiated, averaging around 87% lithiation. This effect of extra capacity stored in the overhang isn’t as prominent in the low SoC window.
Thanks to UHPC’s precision, we were able to directly observe how the graphite overhang influenced the coulombic efficiency, giving us a deeper understanding of degradation dynamics across different SoC windows.
Q: Could you expand on the rebound effect caused by the graphite overhang and how it varies with state of charge?
Sure, focusing on the 75–100% SoC cycling (right-hand side of the plot), we used a fixed discharge capacity of 60 mAh, while allowing the charge capacity to vary. Over time, we observed the charge capacity gradually decaying until it stabilized. Around cycle 42, we ran a check-up cycle with a full 200 mAh charge, which caused a clear shift in capacity.
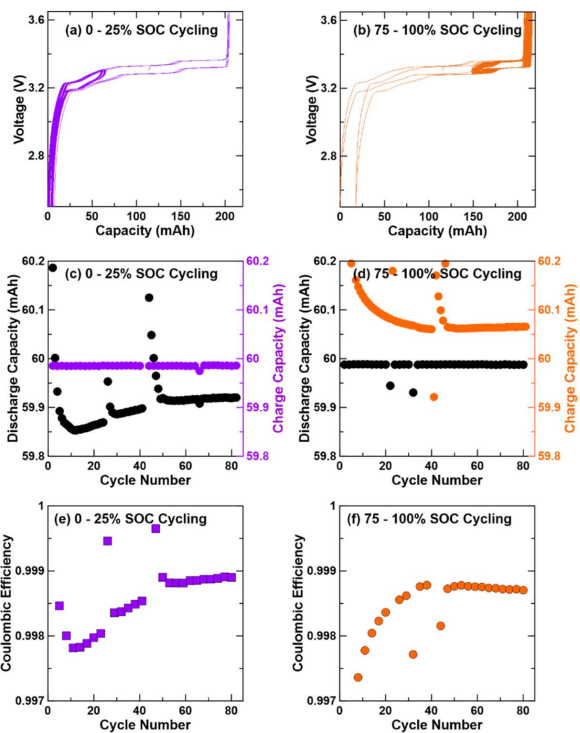
Following that, cycles 43 and 44 showed a gradual recovery, and by cycle 50, the system returned to a steady state.
This same trend was visible in the coulombic efficiency data, where we saw a recovery period after the check-up cycle. Interestingly, the rate of relaxation was similar for both high and low SoC windows, suggesting that the graphite overhang region wasn’t trapping significant lithium.
This was an important confirmation. We had considered whether the graphite overhang might be skewing results by storing extra lithium and making high SoC cycling look artificially worse. But the fast relaxation and return to steady coulombic efficiency showed that the difference in fade was real, not an artifact. The higher SoC window simply had inherently lower coulombic efficiency from parasitic processes like faster SEI growth.
Q: How important was temperature stability for this study? Did you notice any differences between the chambers you used, or did you use the same one throughout?
For our UHPC measurements of coulombic efficiency, we used the NOVONIX supplied temperature chambers, which provided excellent thermal stability, which is critical when aiming for high-precision coulombic efficiency data and accurate fade rate measurements.
While lower-precision cyclers were also used, we found their limitations were more related to charge counting accuracy and electronics, not temperature control.
One of the main pieces of feedback we received on the study was that all our testing was done at elevated temperatures 40°C and 55°C, to accelerate aging and observe degradation faster. That approach aligns with typical accelerated testing methods, but in hindsight, I would have liked to include more realistic operating temperatures, such as 20°C, which is more common for EV users. Even colder conditions, like -10°C, would be relevant for colder climates like Canada.
Testing at lower temperatures would likely introduce additional complexity and new failure mechanisms, such as lithium plating. It would be a valuable extension of this work and something I’d encourage both industry and academic researchers to explore further.
Q: Do you think exposing cells to temperature fluctuations within the same cycling protocol using NOVONIX’s new software controlled Thermal Chamber could help better simulate real-world conditions?
Yes, this is definitely worth exploring now that its available. Most EV battery management systems aim to keep cells at a stable operating temperature but use cases like fast charging or stationary energy storage often involve temperature swings. That introduces a new layer of complexity, especially with LFP cells.
LFP/graphite cells are particularly sensitive to temperature-driven changes in open-circuit voltage, resulting in large swings in SoC. A cell initially at 50% SoC could appear to shift to 45% or 55% just by heating or cooling (+/-10°C), even without any self-discharge occurring. These SoC variations can also occur heterogeneously within a single cell. This thermodynamic effect makes it more challenging to accurately track SoC, especially in thermally fluctuating environments.
This type of study is still rare in literature since constant temperature testing is so common and easier to control. But investigating these dynamic conditions could be incredibly valuable for both industry and academia, offering insight into failure mechanisms and thermodynamic effects that aren’t usually captured in traditional testing.
Q: Now that you have more experience using UHPC, and considering the product enhancements since your study was completed – such as the software controlled thermal chamber, custom variable protocols, and Gamry EIS integration – would you approach anything in this study differently if you were starting it today?
With the new custom variable features in UHPC, you can dynamically adjust test conditions based on real-time capacity measurements. For example, after performing a charge or discharge, you can capture the actual capacity using an “update variable” step. That’s exactly what I would have used to better control capacity.
In the paper, I mention that although we intended to cycle from 0 to 25% state of charge, we used fixed capacities based on the nominal initial capacity. As the cells faded, that window shifted, so by the final cycle, we were actually cycling closer to 0 to 28%. The same issue was even more pronounced in the 75 to 100% SoC case, where degradation was more severe, resulting in a final cycle at 62.5 to 100%.
Using a dynamically updating capacity variable would have allowed us to keep the SoC window truly fixed throughout the test, even as the cell faded, improving the reliability and clarity of the results. With this feature, the test could remain locked to a true 0 to 25% or 75 to 100% SoC window the entire time, making it easier to isolate the effects of SoC on degradation.
Insights & Implications
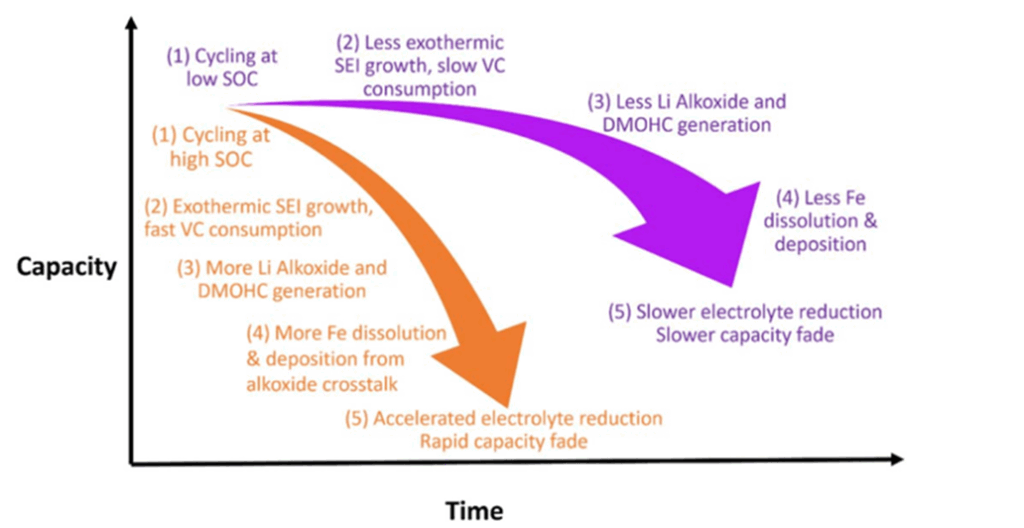
This study demonstrates that the average SoC window impacts the longevity of LFP/graphite battery cells, even at their relatively low nominal voltage. Using UHPC, Eniko and the Dahn Research Group detected subtle degradation mechanisms such as lithium inventory loss, caused by electrolyte reactivity and iron dissolution at higher SoC levels.
Eniko would have taken advantage of some new UHPC features such as custom variable protocols, had they been available at the time of the experiments. The new software update’s ability to dynamically adjust test conditions based on real-time capacity measurements would have allowed for more accurate SoC window control throughout the test. By keeping the SoC window truly fixed using NOVONIX protocol updates, future tests could achieve greater clarity and reliability, isolating the impact of SoC on degradation with less variability.
If you are a UHPC user and want to learn how to leverage custom variables, and new software features in your own battery research, contact BTS Support for technical assistance.
If you’re interested in our R&D prototyping and testing services or would like to inquire about UHPC testing equipment, please reach out to BTS Sales, we’re here to help advance and accelerate your battery innovation pipeline.