Coulombic Efficiency
Coulombic Efficiency (CE) is a simple, but useful metric when analyzing the performance of a cell. Inconsistencies in CE between cells or cell variations can indicate quality issues, differences in electrochemical stability, or changes in the rate capability of materials. However, CE needs to be interpreted carefully due to the many environmental and degradation mechanisms that can influence results.
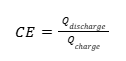
In short, CE describes the “capacity efficiency” of a single charge-discharge cycle of a cell. Another way to put it is “How many electrons put in, are returned back out?”. It can be written in multiple ways, but the most common is

If none of the mechanisms in Figure 3 were present, and the cell performed flawlessly as shown in Figure 2, then a cell would have a CE of exactly 1, since the capacity (number of electrons) and thus lithium ions moving between electrodes during charge and discharge would be the same. However, if mechanisms are occurring that add to the number of electrons counted during charge, or end up decreasing the amount counted during discharge, CE will be less than 1.
Therefore, CE is a useful metric to begin to understand degradation in cells and can, if measured well, be used to predict future performance.
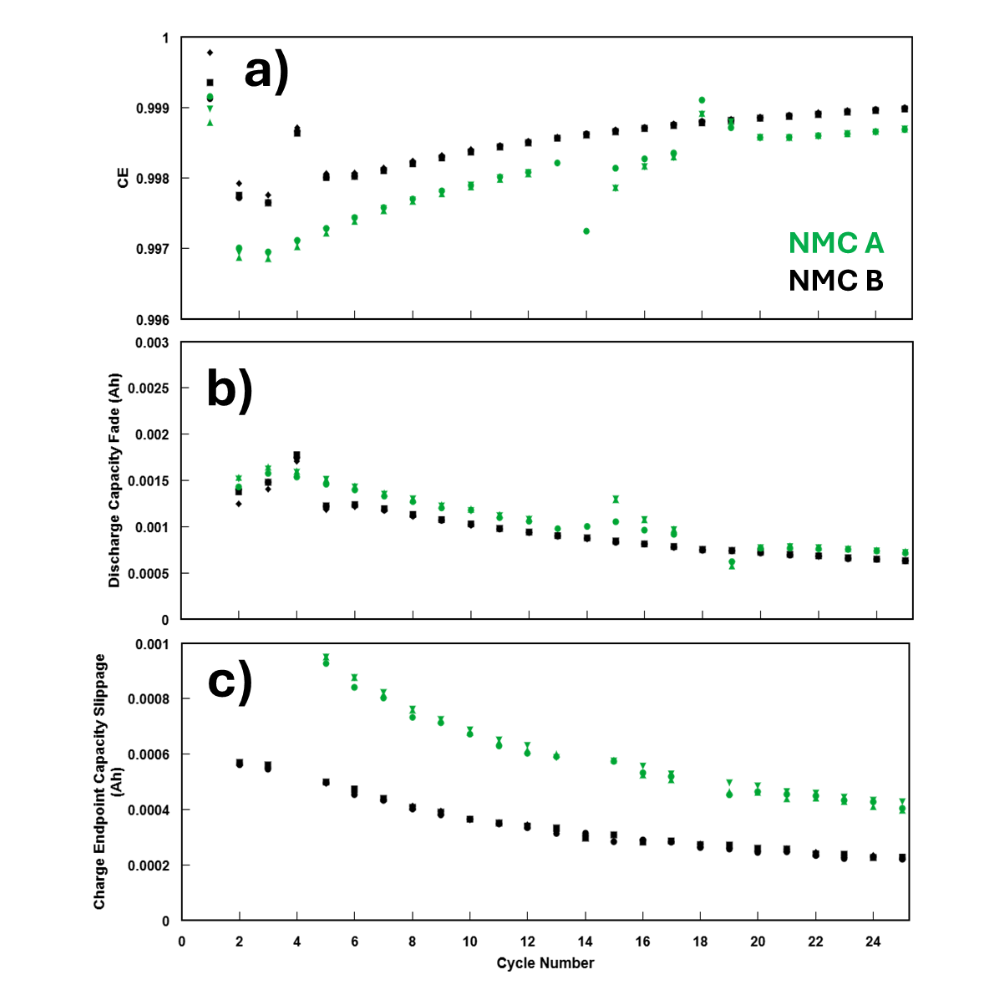
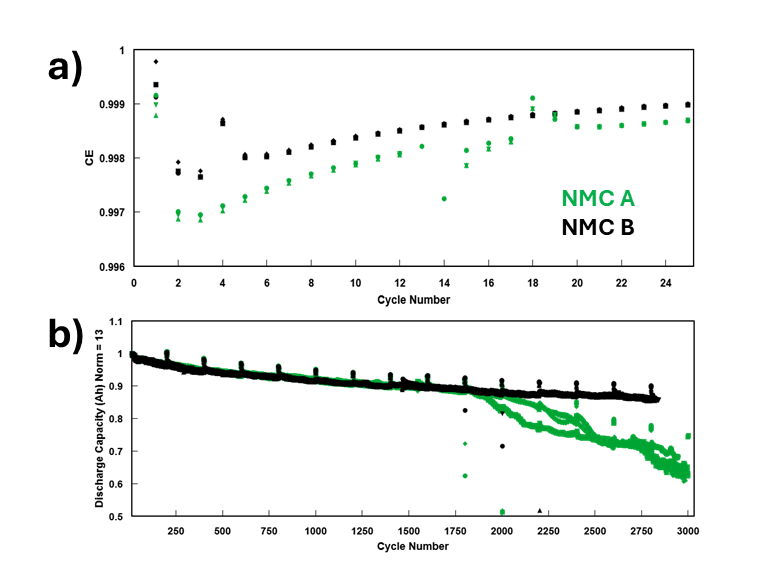
To illustrate, Figure 4a shows a real experiment from NOVONIX’s material development projects in which two NMC622/graphite cell types were cycled on a NOVONIX UHPC system at a low rate of C/10 at 40 °C between 2.5 V and 4.2 V. Three identical cells of each cell type were tested to ensure results were consistent. The cells only differ by the positive electrode material, NMC A and NMC B. Both are specified as NMC 622, but come from two different suppliers and thus have slightly different electrochemical properties such as dopants and coatings. Figure 4a shows a clear and consistent difference in CE between NMC A and NMC B, appearing immediately in the cycle data. These results suggest that NMC A was contributing to electrochemical mechanisms which were either not present, or were to a much smaller degree, than in cells containing NMC B. It should be noted that the difference in CE was around 0.0003, and the differences between identical cells in each group were near indistinguishable, demonstrating the incredible accuracy and precision of UHPC measurements that is not possible on other testing equipment.
Figure 4b shows what occurred when another set of cells from the previous example were put on traditional cycle-aging tests at 1C CC-CV charge and 1C CC discharge rates, 25 °C, and 2.5 V – 4.2 V. After 9 months of cycling, NMC A cells begin to fail. Before this point, there were no indications of differences in performance in any cycle metrics. These data show a simple example of how NOVONIX UHPC is a valuable tool in development of materials and can be extended to almost all areas of cell chemistry, manufacturing, and performance optimization. Typically, degradation mechanisms due to quality issues, compositional/electrochemical differences, etc. are present in cycle one of a cell’s life, and UHPC can be used to detect these differences in cycle two instead of months or years later.
Although this example shows how CE measured by UHPC can help identify performance differences in a tiny fraction of the time as traditional cycling, it does not help to identify or quantify which of the many degradation mechanisms are actually taking place, affecting the ratio of charge to discharge capacities. Fortunately, by looking at cycle capacities in different ways, we can begin to differentiate between types of mechanisms and bring all these components together for a more holistic and valuable picture of the degradation occurring in cells. The following sections on Capacity Fade and Charge Endpoint Capacity Slippage will dive deeper into the different components of CE, and some of the deeper insights we can gain with UHPC.
Capacity Fade
Perhaps the more well-known family of degradation mechanisms, Capacity Fade is caused by one of two things: impedance growth and inventory loss.
- Impedance growth: In an electrochemical cell, increased impedance under constant cycling conditions will make the cell reach its voltage endpoints sooner. This induces a form of capacity fade, although if the cell is cycled at a lower rate, it will appear to recover this capacity.
- Inventory loss: Caused by many degradation modes, is the loss of active ions (we will assume lithium in this case) due to degradation – trapping once available Li+ in sections of particles or coating that are mechanically isolated to strain and cracking, or as electrochemical reaction products at electrode-electrolyte interfaces.
When capacity fade occurs, it can happen during both the charge and discharge step of a cycle, leading to a slight decrease in accessible lithium inventory every subsequent charge and discharge step. The loss of capacity is cumulative between subsequent cycles, meaning that by tracking the relative change between cycles, we can measure Capacity Fade, most often denoted by the Discharge Capacity Fade.
![]()
Since the loss of accessible inventory changes throughout a single cycle, Capacity Fade mechanisms are contributing to CE. The more Capacity Fade occurs in a cycle (larger difference between charge and discharge), the lower the CE will be.
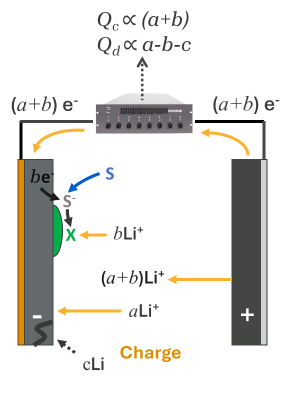
Figure 5 illustrates some Capacity Fade mechanisms more clearly, isolating only these mechanisms from Figure 3 during the charge process.
- Electrolyte Reduction: As electrolyte (S) reacts with the negative electrode, it reduces, gaining an electron and consuming a lithium ion in the reaction, forming some by-product X, and maintaining charge balance. One less lithium ion can be used when discharging the cell, leading to inventory loss.
- Active Material Loss: A small mechanical separation of negative electrode material traps an amount “c” of lithium which is now isolated electronically and electrochemically, and cannot be used in the discharge cycle, also leading to inventory loss.
While these processes look different during the discharge process due to the slightly different charge balance processes in the opposite direction, the net effect is the same – the next charge cycle has less available lithium inventory.
Inventory loss mechanisms are generally well understood and are typically easy to measure over time due to the cumulative nature of Discharge Capacity Fade. On lower resolution equipment, Discharge Capacity Fade may have variation from cycle to cycle, and differences are not clear in early cycles, but eventually, the long-term trend is clear and the average rate of capacity loss can be calculated. This is how much battery research is done today on typical testing equipment. NOVONIX UHPC can help significantly speed up detection of Capacity Fade mechanisms due to the accuracy and precision of capacity measurements.
Figure 6 shows how UHPC Capacity Fade measurements can be used to detect very minor differences in electrochemical performance: Cells with two different electrolyte formulations, but otherwise identical materials were tested on UHPC in identical conditions. The first plot shows the discharge capacity of two cells with each electrolyte. The second plot shows the amount of Discharge Capacity Fade occurring each cycle. Electrolyte 1 has a slightly higher rate of Capacity Fade, suggesting a higher rate of mechanisms reducing the amount of accessible lithium in the cell, or the presence of additional mechanisms due to the difference in electrolyte. The final plot shows the cumulative amount of Capacity Fade over the course of the short experiment and further demonstrates the consistency of data possible with UHPC testing.
While the above example begins to identify specific degradation mechanisms and ways to quantify them, there are still many mechanisms which are electrochemical in nature, but do not contribute to capacity loss at all, and are extremely difficult to measure. The next section will explore Charge Endpoint Capacity Slippage, a cycle metric only possible when cell testing data has adequate accuracy and precision, and thus unique to NOVONIX UHPC systems.
Charge Endpoint Capacity Slippage
In addition to Capacity Fade mechanisms, there are many other degradation mechanisms that are highly impactful on cell lifetime that do not yet have a cycle metric to help quantify them. This section will describe a cycle metric that is new to many battery scientists, Charge Endpoint Capacity Slippage.
Figure 7 shows the mechanisms from Figure 3 that were not explored while discussing Capacity Fade. For simplicity, the diagram shows mechanisms occurring during cell charging. Each mechanism shares a common feature: extra electrons are added at the positive electrode beyond those from normal lithium de-intercalation. These extra electrons are counted by the cycler, adding to charge capacity. Described from top to bottom:
- Transition metal dissolution: Mn2+ (or other ion) leaches from the positive electrode. To create charge balance, electrons migrate through the external circuit, adding to charge capacity. This can impact positive electrode impedance and electrolyte reactivity at the negative electrode through catalytic effects caused by transition metal contamination.
- For simplicity, the charge balance mechanism shown involves a/the Mn2+ ion recombining with electrons at the opposite electrode. Other charge balance mechanisms could also involve salt depletion.
- Physical short: Dendrites, contamination, etc. can cause physical electrical shorts within the cell, providing a shuttle for electrons, contributing to excess charge capacity.
- Reversible Redox Shuttle: An electrolyte species S is oxidized at the positive electrode to S+, donating an electron. S+ is then reduced at the negative electrode back to S, gaining back an electron. The electron is counted through the external circuit. This has an overall neutral affect on the cell chemistry.
- Electrolyte Oxidation: Electrolyte species S is oxidized at the positive electrode irreversibly. To create charge balance in the electrodes and electrolyte, the electron is counted through the external circuit and a lithium-ion from the electrolyte is intercalated into the negative electrode. This not only impacts the composition of electrolyte but adds Li+ to the inventory and depletes salt from the electrolyte.
Each of the mechanisms shown in Figure 7 are, in effect, self-discharge mechanisms. When the cell in Figure 7 is discharged, these mechanisms will all create charge balance through slightly different means, decreasing the number of electrons counted. Therefore, these mechanisms will cause a battery cycler to count more capacity during charge, and less capacity during discharge, directly impacting the CE. It is also important to note that these mechanisms do not directly cause the loss of any capacity (and due to charge-balance as shown in Figure 7, can actually increase lithium inventory). While the origin of the term “slippage” will be explained shortly, these types of mechanisms discussed above will be referred to hereon as “slippage-based” mechanisms.
Slippage-based mechanisms are difficult to directly quantify when cycling a cell. They can be directly measured using methods like voltage-holds, which, after all kinetic effects (lithium movement between electrodes) reach equilibrium so no lithium is moving between electrodes, the current being counted in Figure 7 is exactly proportional to the rate of these mechanisms (z = 0). While cycling a cell, this direct measurement isn’t possible, so a useful metric can be defined as a proxy for quantifying these mechanisms.
Figure 8 illustrates a voltage curve of a typical NMC-graphite lithium-ion cell. When plotted vs cumulative capacity, zeroed at the bottom of the first charge cycle, each subsequent cycle tends to shift towards higher capacity. Looking back to Figure 7, the cell testing system will overcount charge capacity due to slippage-based mechanisms. During discharge, it will undercount capacity. This alone will cause the voltage curve at the end of discharge to not quite make it back to 0 Ah capacity (ignoring the effects of Capacity Fade). During the next charge, the cycler will overcount capacity again, such that the charge endpoint voltage ends further along the capacity axis than the previous cycle’s charge endpoint capacity. The bottom plot in Figure 8 shows a zoom-in of two cells cycled for 25 cycles. Each cycle, there is a change in the position of the charge endpoint. This change is called Charge Endpoint Capacity Slippage. Electrolyte 1 has a much higher rate of Charge Endpoint Capacity Slippage, suggesting that it may have a much higher rate of these “slippage-based” mechanisms
To illustrate the usefulness of Charge Endpoint Capacity Slippage as a cycle metric, consider the example experiment from the CE section. Figure 9a shows the CE vs cycle number, Figure 9b shows Capacity Fade, and Figure 9c shows the Charge Endpoint Capacity Slippage vs cycle number. Recall the cycle aging in Figure 4b: NMC A failed well before NMC B without any warning signs in cycle metrics. Figure 9a was used earlier to identify that there was a difference in electrochemical mechanisms occurring between NMC A and NMC B. However, CE alone could not identify what types of mechanisms were occurring, or where the major contributing factor to the failure was occurring. Figure 9b shows the Capacity Fade of cells with both NMC materials are near identical, suggesting that there is minimal to no additional inventory loss occurring due to the change in NMC material. However, Figure 9c clearly shows that immediately during testing NMC A has around twice the rate of slippage-based mechanisms occurring. The higher Charge Endpoint Capacity Slippage is the cause of the lower CE in NMC A. This suggests that NMC A is creating a higher rate of mechanisms such as electrolyte oxidation or transition metal dissolution which, after 9 months of cycle testing, ultimately contributes to “rollover” or “knee-point” failure seen in Figure 4b due to depletion of salt or other electrolyte species caused by slippage-based mechanisms. Complementary tests and correlations to factors such as surface area, particle coatings, surface Li residuals, etc. could be used to further understand the nature of these reactions, and set thresholds and targets for further rounds of development on a significantly shortened time scale compared to traditional cycling.
The results here illustrate the power of using UHPC metrics, particularly Charge Endpoint Capacity Slippage, to rapidly understand degradation in cells and rapidly iterate. Rather than waiting 9 months for results as shown in Figure 4b, the UHPC results in Figure 9 can be used to shorten development cycles to weeks or even days, due to the ability to accurately and precisely extract critical information about rates of degradation mechanisms in cells.
As a final thought, consider the following scenario: What could have happened if a critical supply-chain decision for a cathode manufacturer testing formulations NMC A and NMC B had to occur based on 6 months of cycling data? How would UHPC testing have affected this decision?
To download a copy of the UHPC e-book, fill out the form below.
"*" indicates required fields