Why do we count coulombs?
In all aspects of battery development – from raw material synthesis and electrolyte formulation to production optimization and warranty estimations, coulomb counting is used to understand the quality, consistency, and performance of batteries and battery cells. From here forward, the term “cell” will be used to refer to a single electrochemical battery cell, and for simplicity, only single-cell testing will be discussed.
The term “coulometry” does not imply one specific test type, but a myriad of applications including: charge discharge cycling, rate testing, impedance testing, etc. In all cases, these types of tests rely on sourcing and sensing the current and voltage applied to a cell with specially designed electronic equipment. The equipment’s ability to accurately and precisely source and sense the applied currents and voltages limits its ability to detect minor differences in performance, leading to varying testing times being needed to obtain enough confidence to make critical, informed decisions.
The data collected from cell testing are then processed and analyzed into time-series and cycle metric data to understand underlying cell performance and degradation. This document will primarily focus on cycle metrics, and discuss in detail the importance of coulomb counting and why NOVONIX Ultra-High Precision Coulometry (UHPC) equipment is needed to obtain critical insights from these data that no other cell testing systems can achieve.
Terminology: Precision, Accuracy, Resolution, and More
Before diving into electrochemistry and cell performance, it is important to understand the different terms used to describe the function and performance of a cell testing system. Both precision and accuracy are important to understand battery performance, especially when trying to measure small differences in performance between samples or understanding the variation in a manufacturing lot/batch of cells. Precision is also different than resolution and noise, other common specifications in metrology. Another difference that is important to understand is between sourcing and sensing.
Sourcing is what the electronics are applying to the circuit (cell).
Sensing is what the electronics are recording as the measurement of the circuit (cell). Accuracy is how close a value is to the ideal or target value.
Precision is how repeatable or consistent a measurement is.
Resolution is the smallest detectable change in a measurement. Ideally, this is a much smaller value than the accuracy and precision specification. Noise is the degree of randomness and interference in the signal, limiting the effective resolution.
Figure 1a shows different combinations of accuracy and precision on a target diagram. A cell testing system, or “cycler”, with high precision and low accuracy (top right) may have consistent, clean data traces, but all values will have a consistent bias away from the actual value. A cycler with low resolution (bottom right) will not be able to capture differences between points that a cycler with slightly higher resolution would (bottom left). Figure 1b shows a simplified diagram of the differences between source and sense circuits in a battery tester connected to a test subject (cell). (Note: Not all testing equipment operates the same way. This diagram represents the way NOVONIX UHPC equipment operates). The source current circuit supplies the cell with a requested current as programed in the protocol by a user. The sense circuit provides an independent measurement of this current via a shunt measurement, and records this value in the data file.
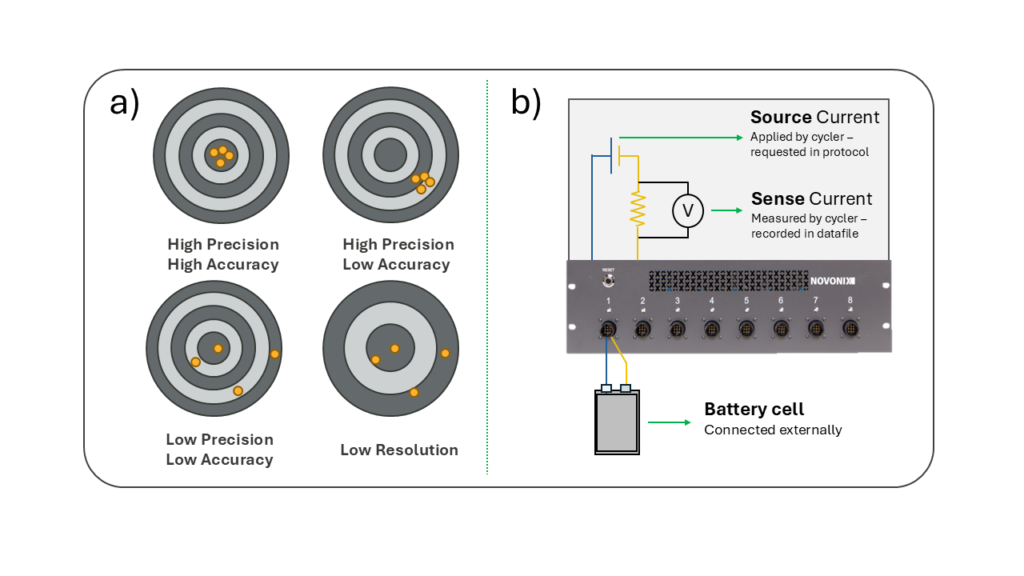
When trying to understand the performance of a battery cell or other electrochemical system, the sourcing and sensing accuracy, precision, and resolution are important. However, as long as the sourcing specs are sufficient to not cause a large difference in performance between repeated tests or different test channels, the sensing specs are much more important, as these define what is actually being applied to the cell.
For example, if a cycler has a current sourcing accuracy of +/- 0.05% at 1 A. The difference in performance of charging and discharging a 1 Ah cell at a source current of 1.0005 mA vs 0.9995 mA is negligible and won’t lead to measurable differences in performance. However, if the sensing accuracy is +/- 0.05%, over one cycle at 1C, the cycler-measured capacity could be recorded between 0.9995 – 1.0005 Ah if exactly 1.0000 A was sourced. In all cyclers, these specifications apply to both charge and discharge directions. This means that the discharge capacity of one channel could be over- or under-counting capacity by up to 0.05%, and the same for charge capacity. Depending on how the cell is tested, these specs could cause one channel to report larger discharge capacities than charge in the data, and vice versa on the next channel, even if the cells being tested are identical! Most battery researchers will be familiar with this when looking at sensitive metrics like coulombic efficiency. Equipment with better sense accuracy specs will achieve more consistent CE values channel to channel, and precision will lead to less variation cycle to cycle.
The degree of accuracy and precision a battery tester is capable of can lead to big differences in interpreting cycle metrics like Capacity Fade, Coulombic Efficiency, and, if the data is good enough, enable new insightful metrics like Charge Endpoint Capacity Slippage. Third-party validation has shown NOVONIX UHPC has the best performance of any precision cycler available by at least an order of magnitude of accuracy and precision, and is the only system capable of measuring subtle differences in cell performance to be used for accurate lifetime prediction, quality analysis, and high-throughput, rapid technology development. Ultimately, the value of UHPC comes down to the time savings and confidence of decisions made by using precision metrics and informed analysis. The metrics which enable these insights, and why accuracy and precision are important in each case, will be explained in the coming sections.
What are we really measuring?
When interpreting electrochemical data, it is useful to remind ourselves what we are directly measuring when testing a cell, and what we are interpreting based on those measurements. A popular diagram in battery research shows electrons flowing through the external circuit (a cycler in our case), and for each electron, a lithium ion being taken from one electrode and one inserted into the other.
Figure 2 shows this simplified picture. During charge, lithium is extracted from the positive electrode (often referred to as the cathode in secondary battery terminology) and inserted into the negative electrode (anode). To create charge balance, electrons move through the cycler and to the opposite electrode. However, the real picture is much more complex, as there are many, often unwanted, mechanisms that occur during operation leading to capacity loss, impedance growth, degradation of materials, and mechanical issues.
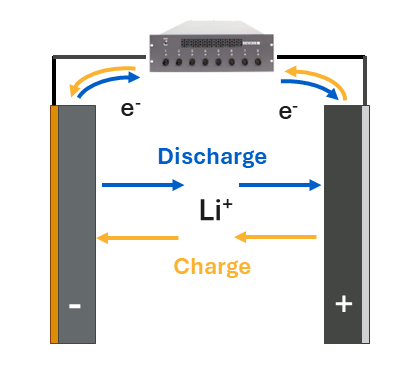
Figure 3 shows a more detailed picture of some of the physical and electrochemical mechanisms that can occur in a cell. On one hand, Figure 3 illustrates the complexity of interpreting electrochemical data. However, it also suggests that with measurements of current and voltage that are both highly precise and highly accurate, we can learn a great deal about the degradation occurring in cells.
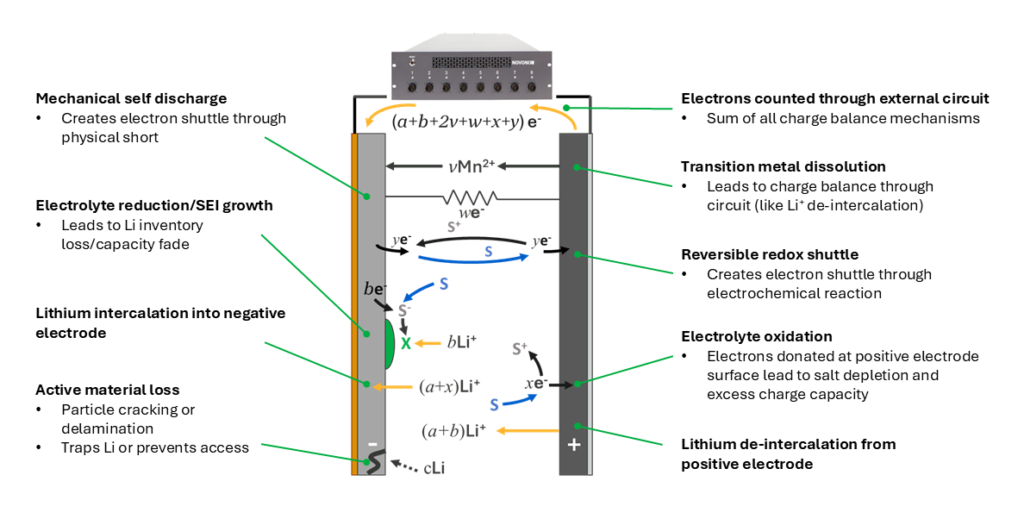
The following sections will break down some of these mechanisms and define how, during the charge-discharge cycling of a cell, we can use this knowledge to define valuable cycle metrics to help interpret degradation and apply these measurement and analysis techniques to advance battery technology faster than with traditional methods and equipment.
To download a copy of the UHPC e-book, fill out the form below.
"*" indicates required fields