Author: Pascal Ruzzante, Cell Research Scientist
What is “wetting” in Li-ion cell formation?
In the production of Li-ion batteries, cells are filled with electrolyte and must undergo a formation process in which the cell is charged and discharged to form passivating layers on the anode and cathode and to place the cell at a stable voltage for storage prior to end use. Before formation charging can begin, however, the cell must first undergo a ‘wetting’ process during which the electrolyte infiltrates the pores of the anode and cathode.
Attempting to charge a cell before it is fully wetted can lead to uneven lithiation, localized lithium plating, and interfacial inhomogeneity, all of which negatively impact safety, performance, and lifetime.
At the same time, formation is one of the most resource-intensive processes in cell manufacturing and represents a significant bottleneck on production capability as each cell occupies a cycler channel for the duration of the process. Increasing production capacity therefore requires either installing additional cycler infrastructure or reducing formation time. For this reason, manufacturers invest heavily in optimizing formation protocols to minimize channel occupancy.
One of the most effective pathways to improving production throughput is reducing wetting time – if and only if – full and uniform wetting can be reliably verified.
What is EIS and what does it measure?
Electrochemical Impedance Spectroscopy (EIS) measures the frequency response of a system to a small applied sinusoidal AC current or voltage signal. This technique provides insight into the magnitude and physical origin of different resistive contributions within the electrochemical system.
In this study, the focus is on the high-frequency region (HFR) of the EIS spectrum. The HFR is typically dominated by Ohmic resistance contributions, arising primarily from the resistance of system components such as the electrolyte, current collectors and external circuit wiring. Because the resistance of wiring and current collectors remains constant during wetting, any observed change in HFR resistance can be attributed primarily to electrolyte-related effects.
The electrical resistance (R) of a conducting material is given by

where is the intrinsic resistivity of the conducting substance, is conduction path length, and is the cross-sectional area normal to the direction of current flow.
The intrinsic resistivity of the electrolyte in a stable electrochemical system does not change during the wetting period. However, as electrolyte absorbs into the pores of the electrodes, it contacts an increasing fraction of the electrode surface area. This effectively increases the conductive cross-sectional area A, resulting in a decrease in measured resistance.
How can EIS be used to determine minimum required wetting time?
As electrolyte progressively fills the electrode pore structure, the system resistance decreases. Once the majority of pores are wetted, the rate of resistance decrease slows and the resistance approaches a steady value, indicating completion of the wetting process.
By periodically performing EIS scans during wetting, this resistance evolution can be tracked in real time, enabling direct measurement of wetting progression.
This methodology was adapted from work by Günther Reinhart’s group (Florian J. Günter et al., J. Electrochem. Soc., 2018, 165, A3249), where EIS resistance changes were correlated with in-situ neutron radiography to directly visualize electrolyte infiltration. While scientifically powerful, that experimental configuration relied on highly specialized infrastructure and was limited to single-cell operation, making it impractical for industrial-scale deployment.
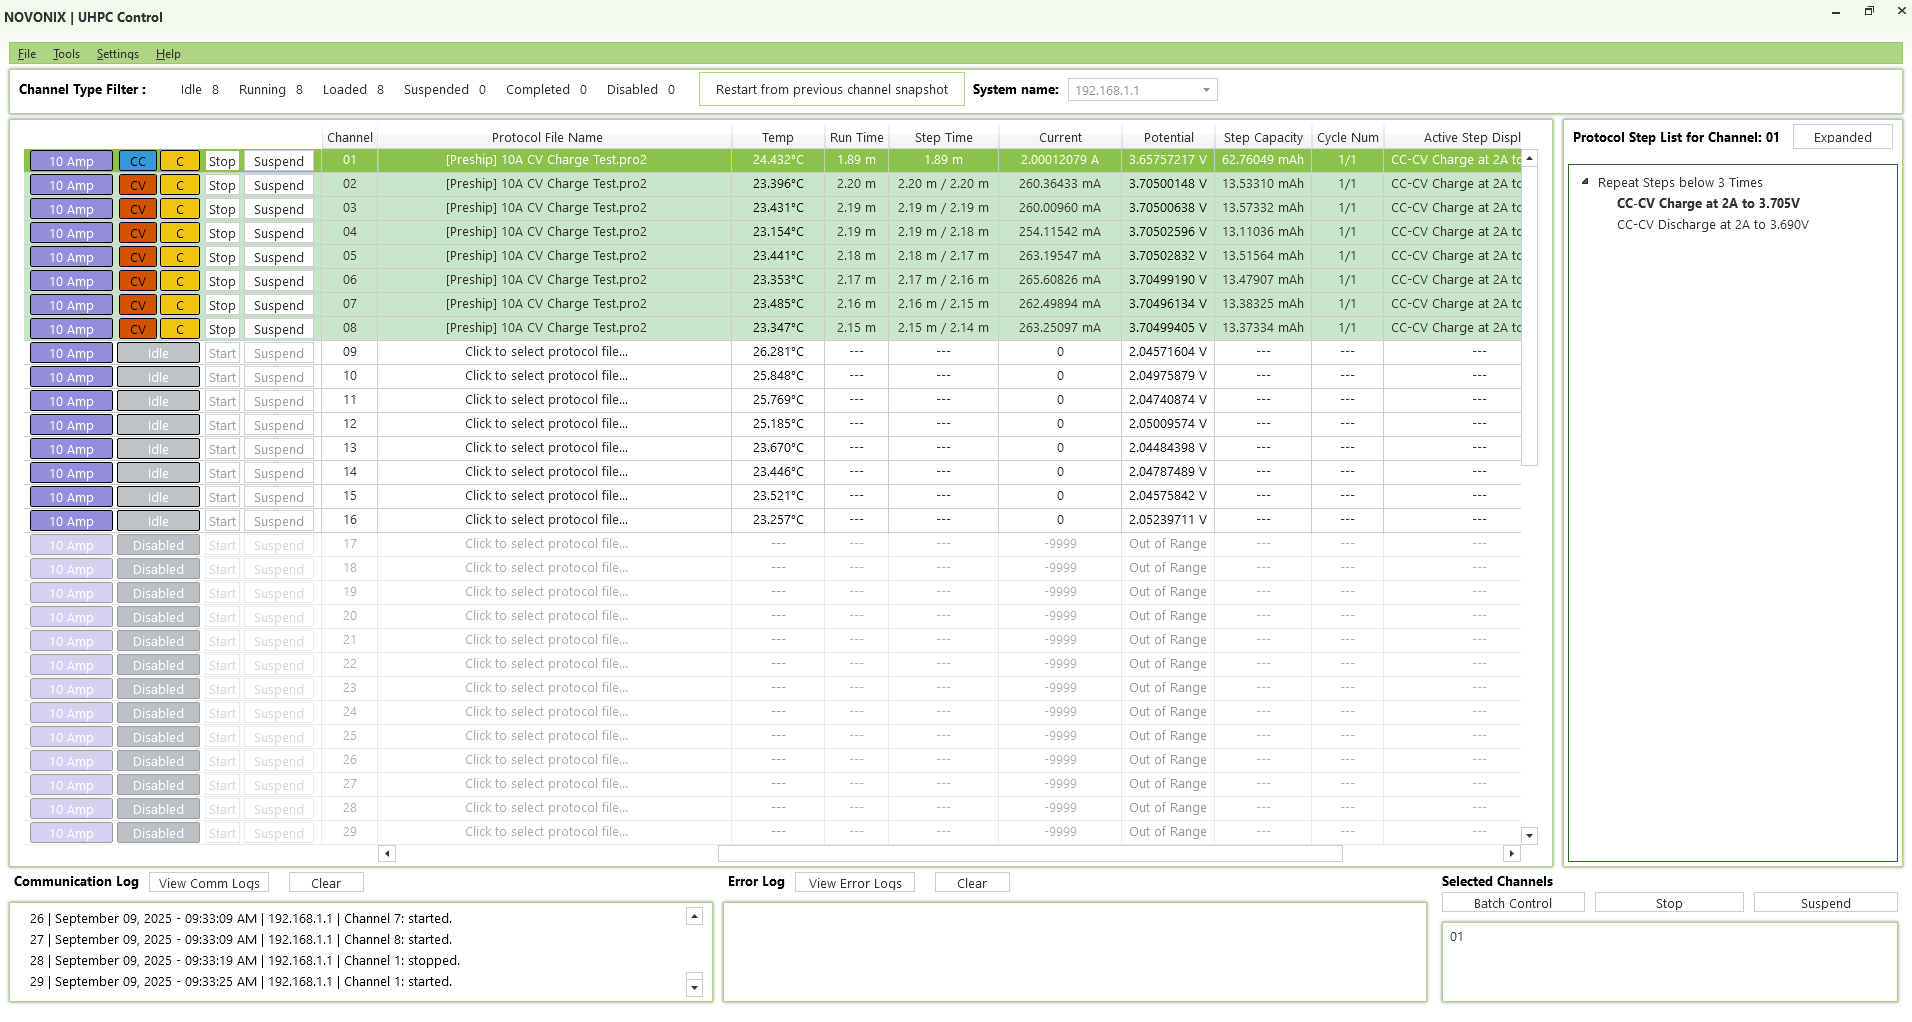
Here, the method is implemented using a commercially available NOVONIX UHPC 10A cycler directly integrated with a Gamry EIS system. This platform delivers ultra-high accuracy and precision in current and voltage measurement, supports parallel multi-cell testing, and provides seamless protocol integration between cycling and impedance diagnostics.
Experimental:
18650 cylindrical cells were manufactured at NOVONIX’s R&D Services facility in Halifax, Nova Scotia. Cells used a commercial NMC811 cathode (4 mAh/cm² loading, compressed to 3.3 g/cm³) and a synthetic graphite anode (slightly higher loading to achieve an N/P ratio of 1.07, compressed to 1.55 g/cm³). Electrolyte consisted of 1.2 M LiPF₆ in EC:EMC:DMC (25:5:70 wt/wt) with 2 wt% vinylene carbonate (VC).
Cells underwent 24 hours of an electrolyte wetting process on an integrated NOVONIX UHPC 10A–Gamry EIS system at 25 °C. One group was held at a constant potential of 1.5 V, while the second group remained at open-circuit voltage (OCV). EIS scans were performed periodically (every 10 minutes for the first 4 hours, then every 30 minutes for the remaining 20 hours), targeting frequencies from 100 kHz to 1 Hz with 10 points per decade and a 10 mV AC excitation signal. Each scan required approximately 60 seconds.
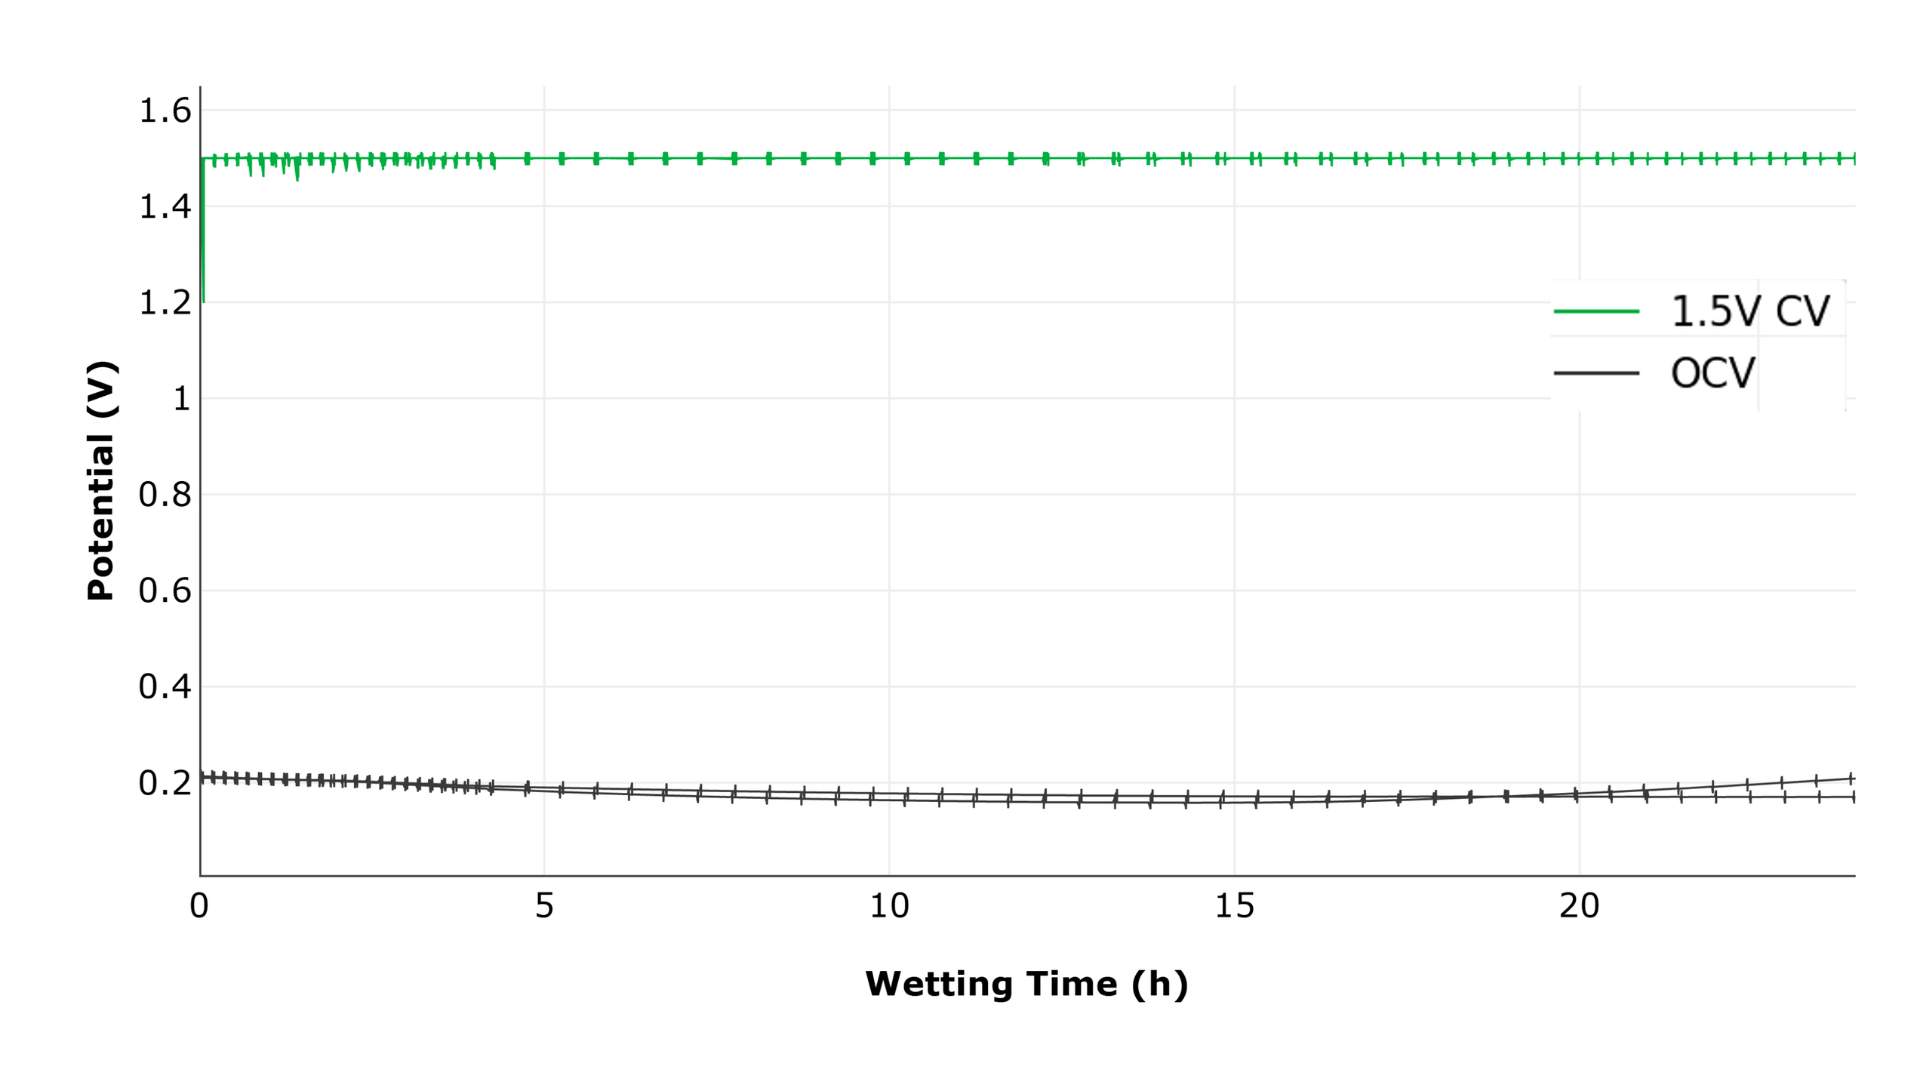
Figure 1: Voltage during the 24-hour wetting period. One group was held at 1.5 V, while the second group remained at OCV.
EIS Interpretation:
Each EIS scan generates complex impedance data, consisting of real (Re(Z)) and imaginary (Im(Z)) components, typically visualized using a Nyquist plot, where –Im(Z) is plotted versus Re(Z).
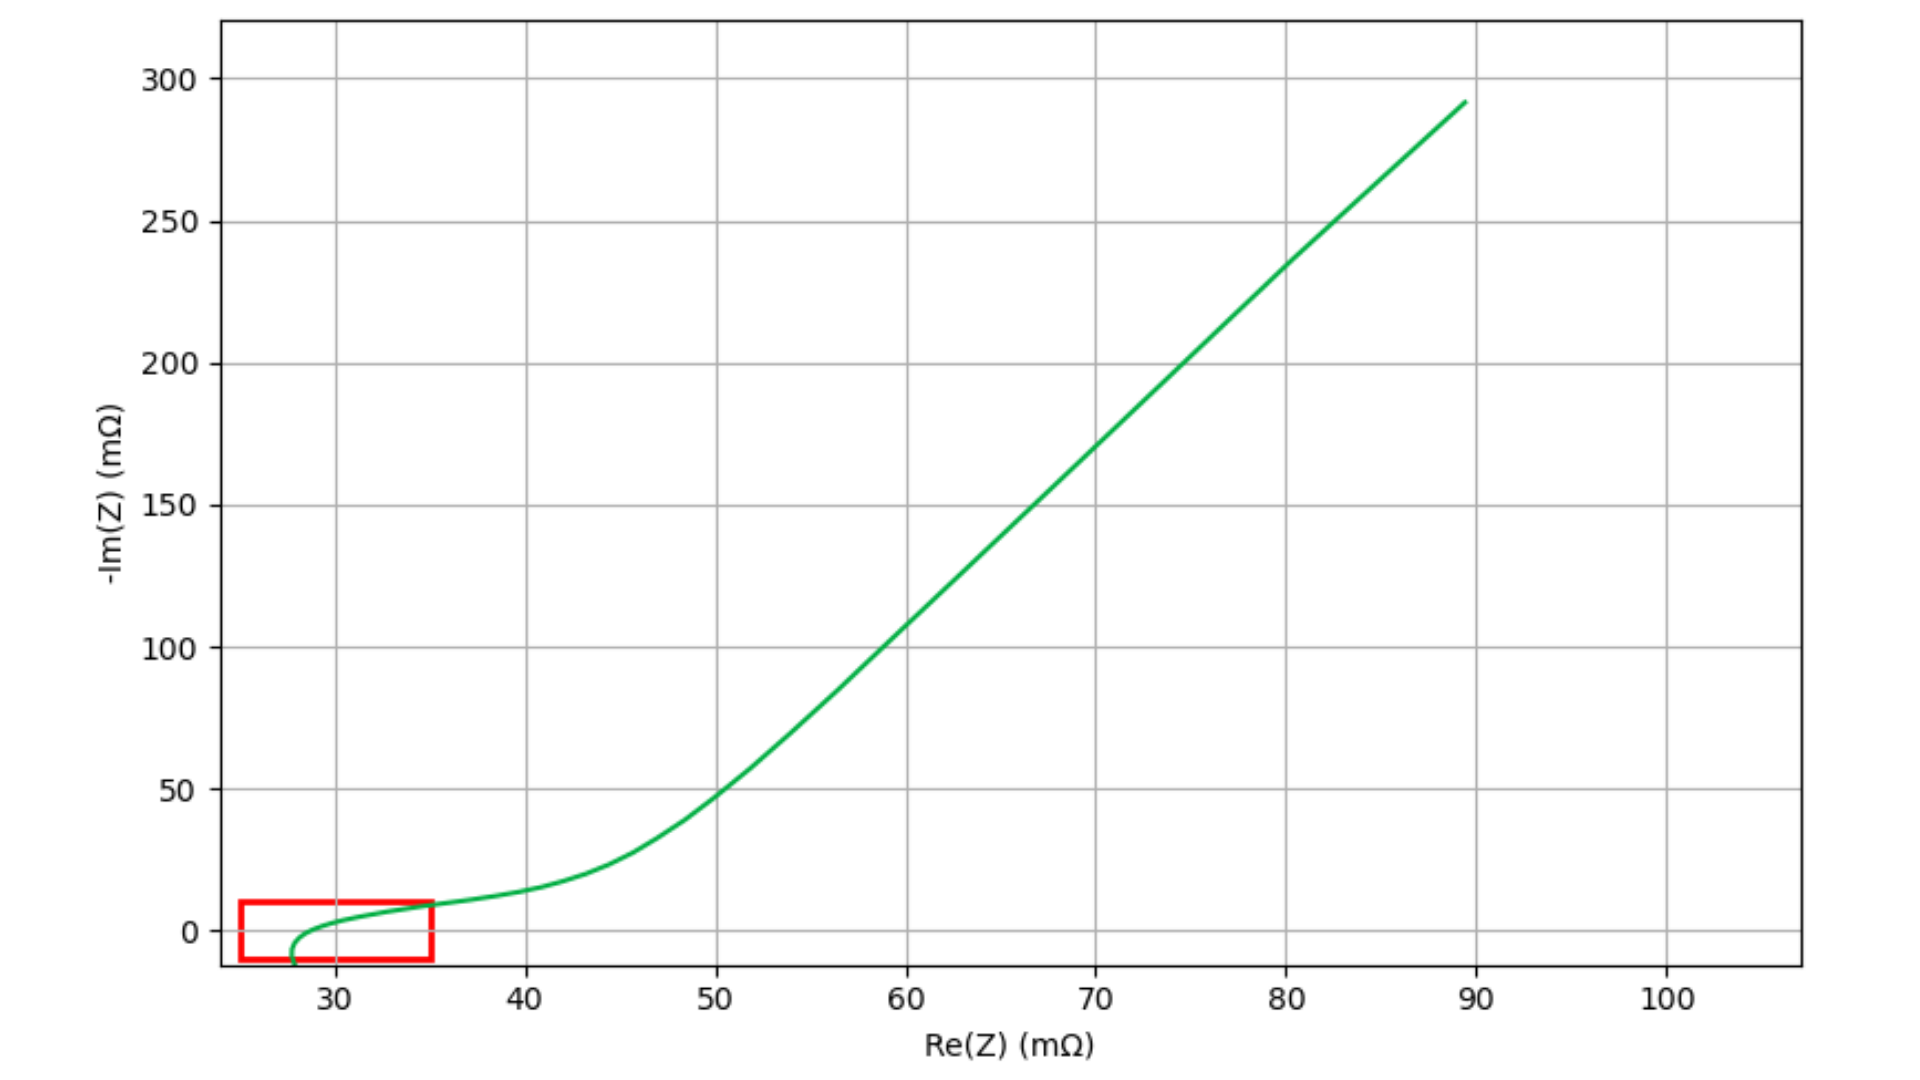
Figure 2: Example Nyquist plot depicting a typical EIS spectrum on a filled cell during the wetting period.
In this study, the high-frequency region (HFR) is defined as the region surrounding the Re(Z)-axis intercept. Figure 2 shows a single Nyquist plot of the EIS spectrum obtained from one of the cells in this study. The HFR area of interest is enclosed in the red rectangle. This area is enlarged in Figure 3 and all ~64 EIS scans for this cell are displayed, increasing in darkness for higher wetting times. As wetting progresses, the Nyquist spectra systematically shift toward lower Re(Z) values. By interpolating and tracking the Re(Z) intercept over time, wetting progression can be quantitatively monitored.
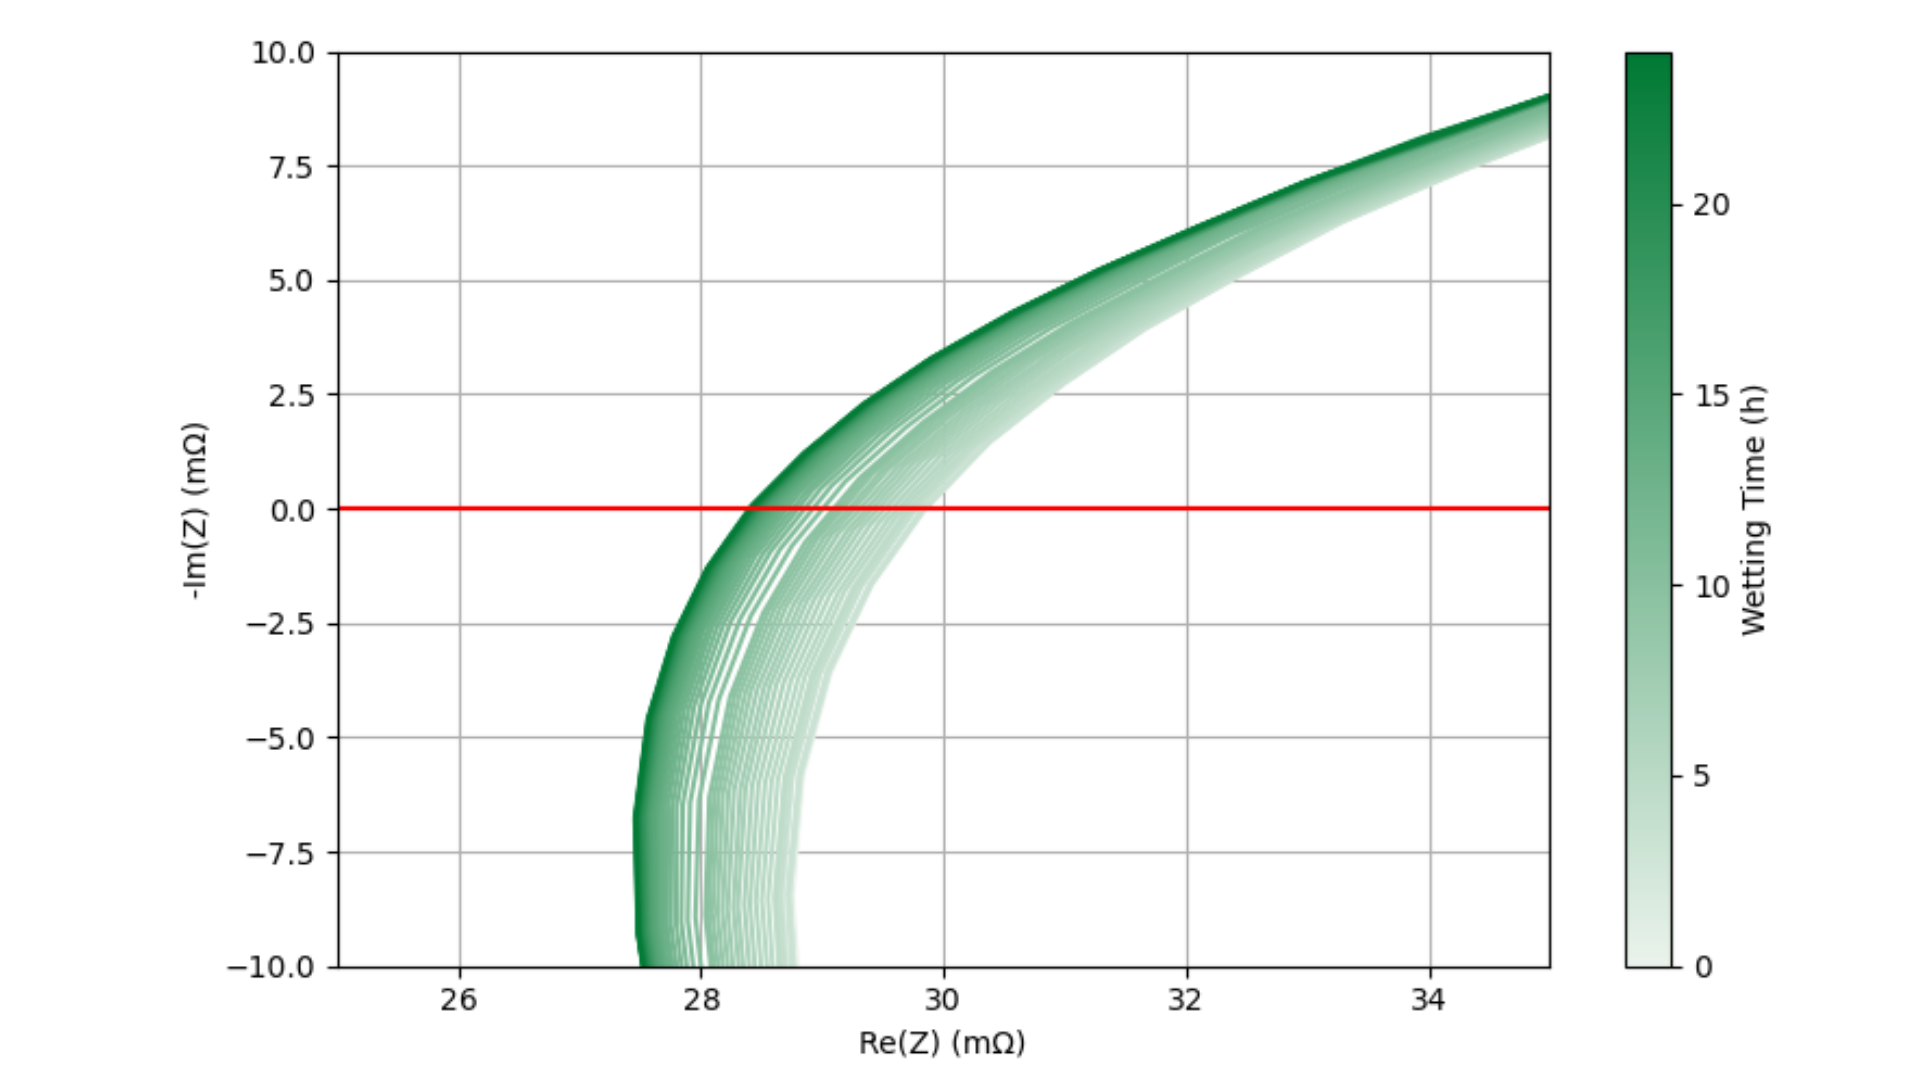
Figure 3: Nyquist plots for one cell over the 24h wetting period. Scale is enlarged to zoom in on the HFR surrounding the Re(Z) axis intercept.
Tracking the Re(Z) intercept to determine minimum wetting time
The normalized Re(Z) intercept as a function of wetting time is shown in Figure 4. An initial slight resistance increase is observed in the first 1–2 hours, followed by a steep decrease corresponding to rapid wetting of the largest and most accessible pores. After ~5 hours, the rate of decrease slows as electrolyte penetrates smaller, less accessible pore structures. By approximately 10 hours, the resistance approaches a plateau, indicating near-complete wetting. At this point, the cell can be safely charged.
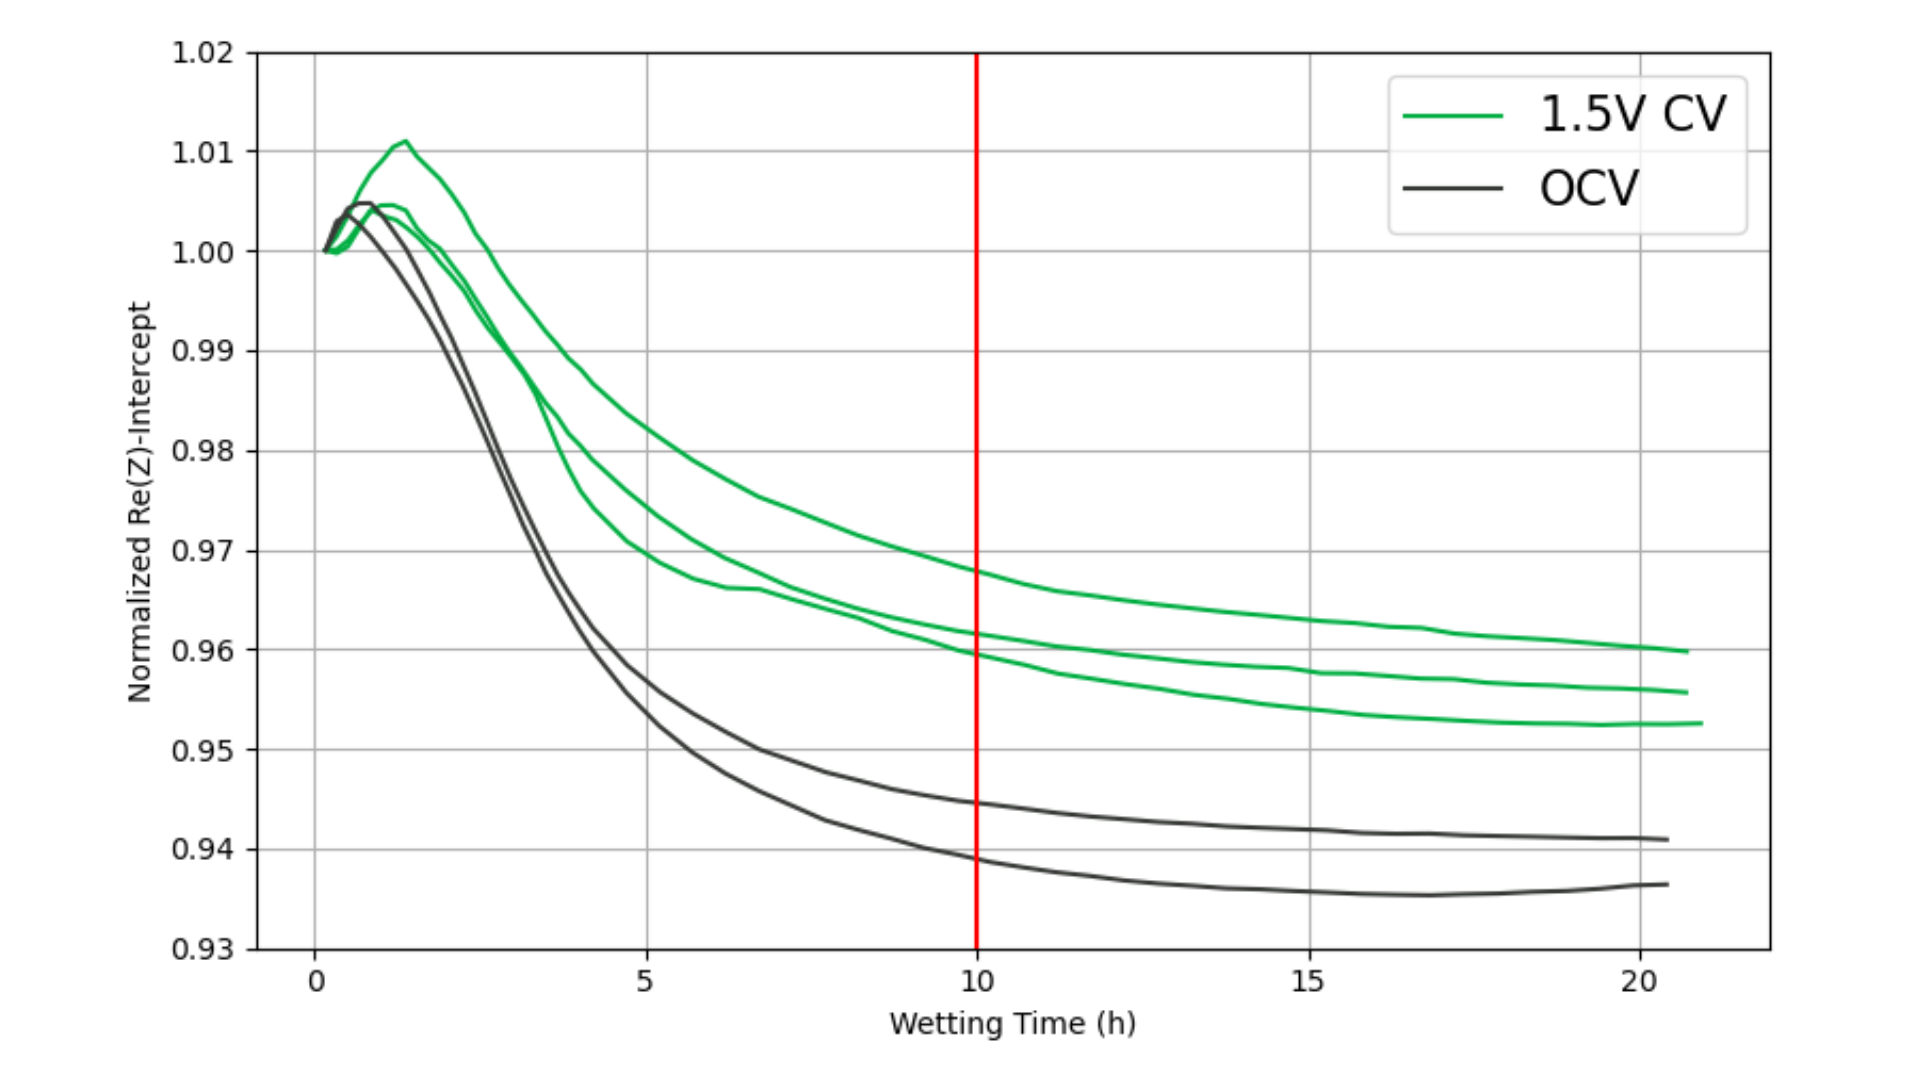
Figure 4: Normalized Re(Z) intercept as a function of wetting time.
Importance of tracking rate of change vs absolute resistance
Although the absolute resistance values differ between the 1.5 V and OCV groups (Figure 4), both groups reach their resistance plateaus at the same time. This is confirmed by examining the time derivative of the Re(Z) intercept (Figure 5), which converges for both groups after ~5 hours.
This demonstrates that wetting completion should be identified based on the rate of change of resistance, rather than absolute resistance magnitude.
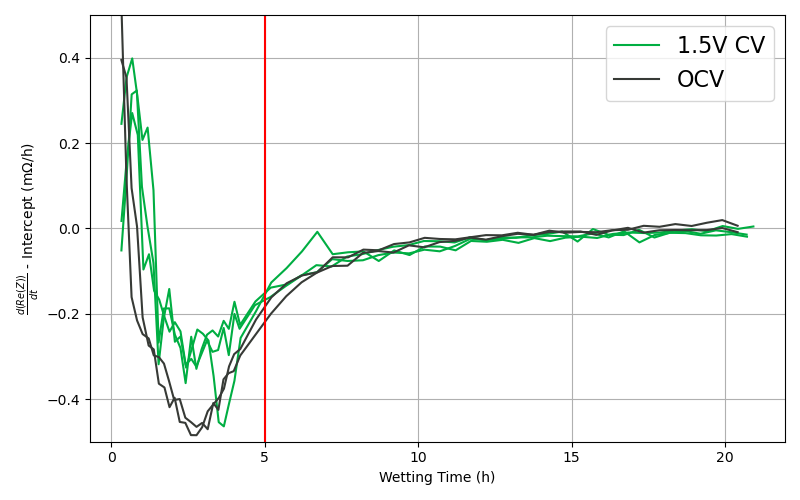
Figure 5: Time derivative of the change of the Re(Z) intercept. As this approaches 0, the resistance is no longer changing, and the cell is fully wetted and ready to begin the first charge.
Using UHPC for high quality differential capacity and voltage analysis
UHPC provides exceptional voltage and current resolution, enabling high-fidelity differential voltage (dV/dQ) and differential capacity (dQ/dV) analysis without data smoothing, which often obscures subtle but meaningful features.
Figure 6 shows dQ/dV during the electrolyte reduction region of the first formation charge. The VC reduction peak at ~2.8 V is clearly resolved, along with subtle differences in the 2.2–2.6 V region (see inset) between wetting conditions. This demonstrates UHPC’s sensitivity to small electrochemical variations.
Figure 7 presents the full cycle dQ/dV at C/20 where each peak corresponds to a distinct intercalation or deintercalation process occurring in the graphite anode or NMC cathode. UHPC enables detection of small peak shifts and shape changes, providing a non-destructive, in-situ method for tracking degradation mechanisms.
In many cases, UHPC allows detection of predictive performance differences within the first 3–10 cycles, long before conventional cyclers reveal divergence, which is often months or sometimes years later.
With UHPC, it is often possible to detect differences as early as the first 3-10 cycles which can be predictive of cell performance outcomes which otherwise would only appear after thousands of cycles and months of testing in a standard cycler.
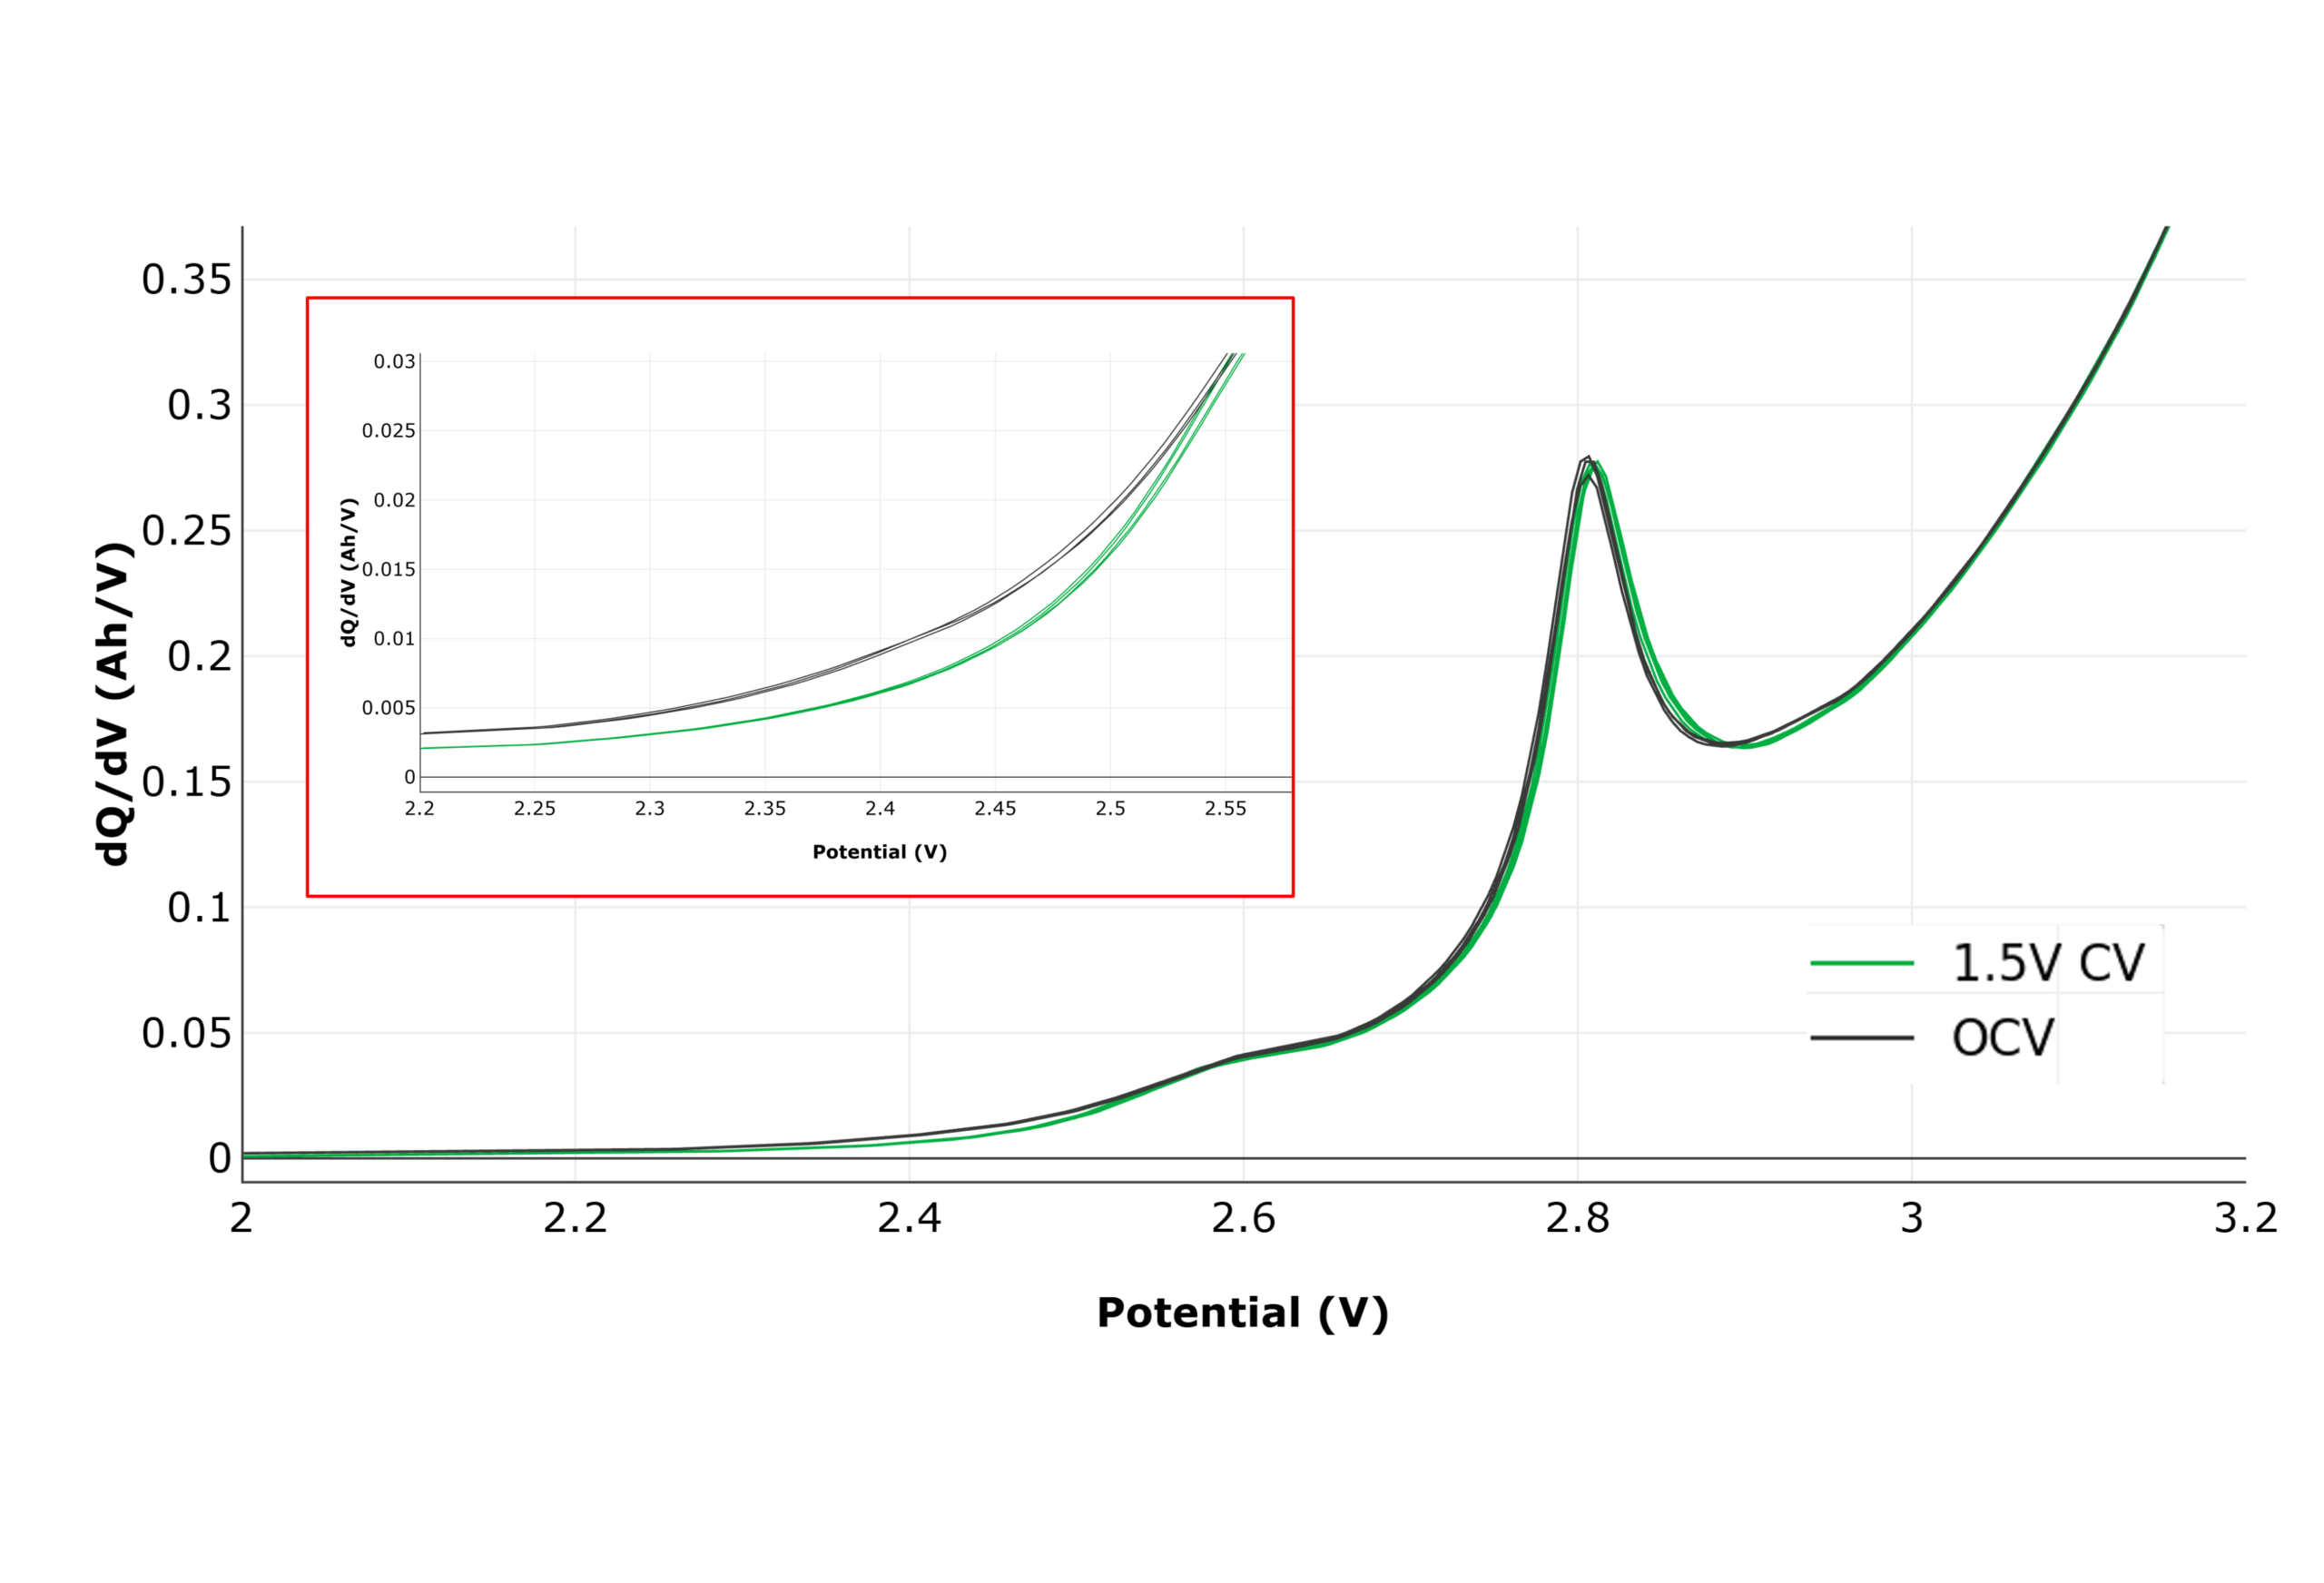
Figure 6: Differential capacity (dQ/dV) in the electrolyte reduction region of the formation first charge. Inset: Enlarged in the 2.2V-2.6V region to highlight the ability to distinguish cell groups through minor differences in dQdV using UHPC.
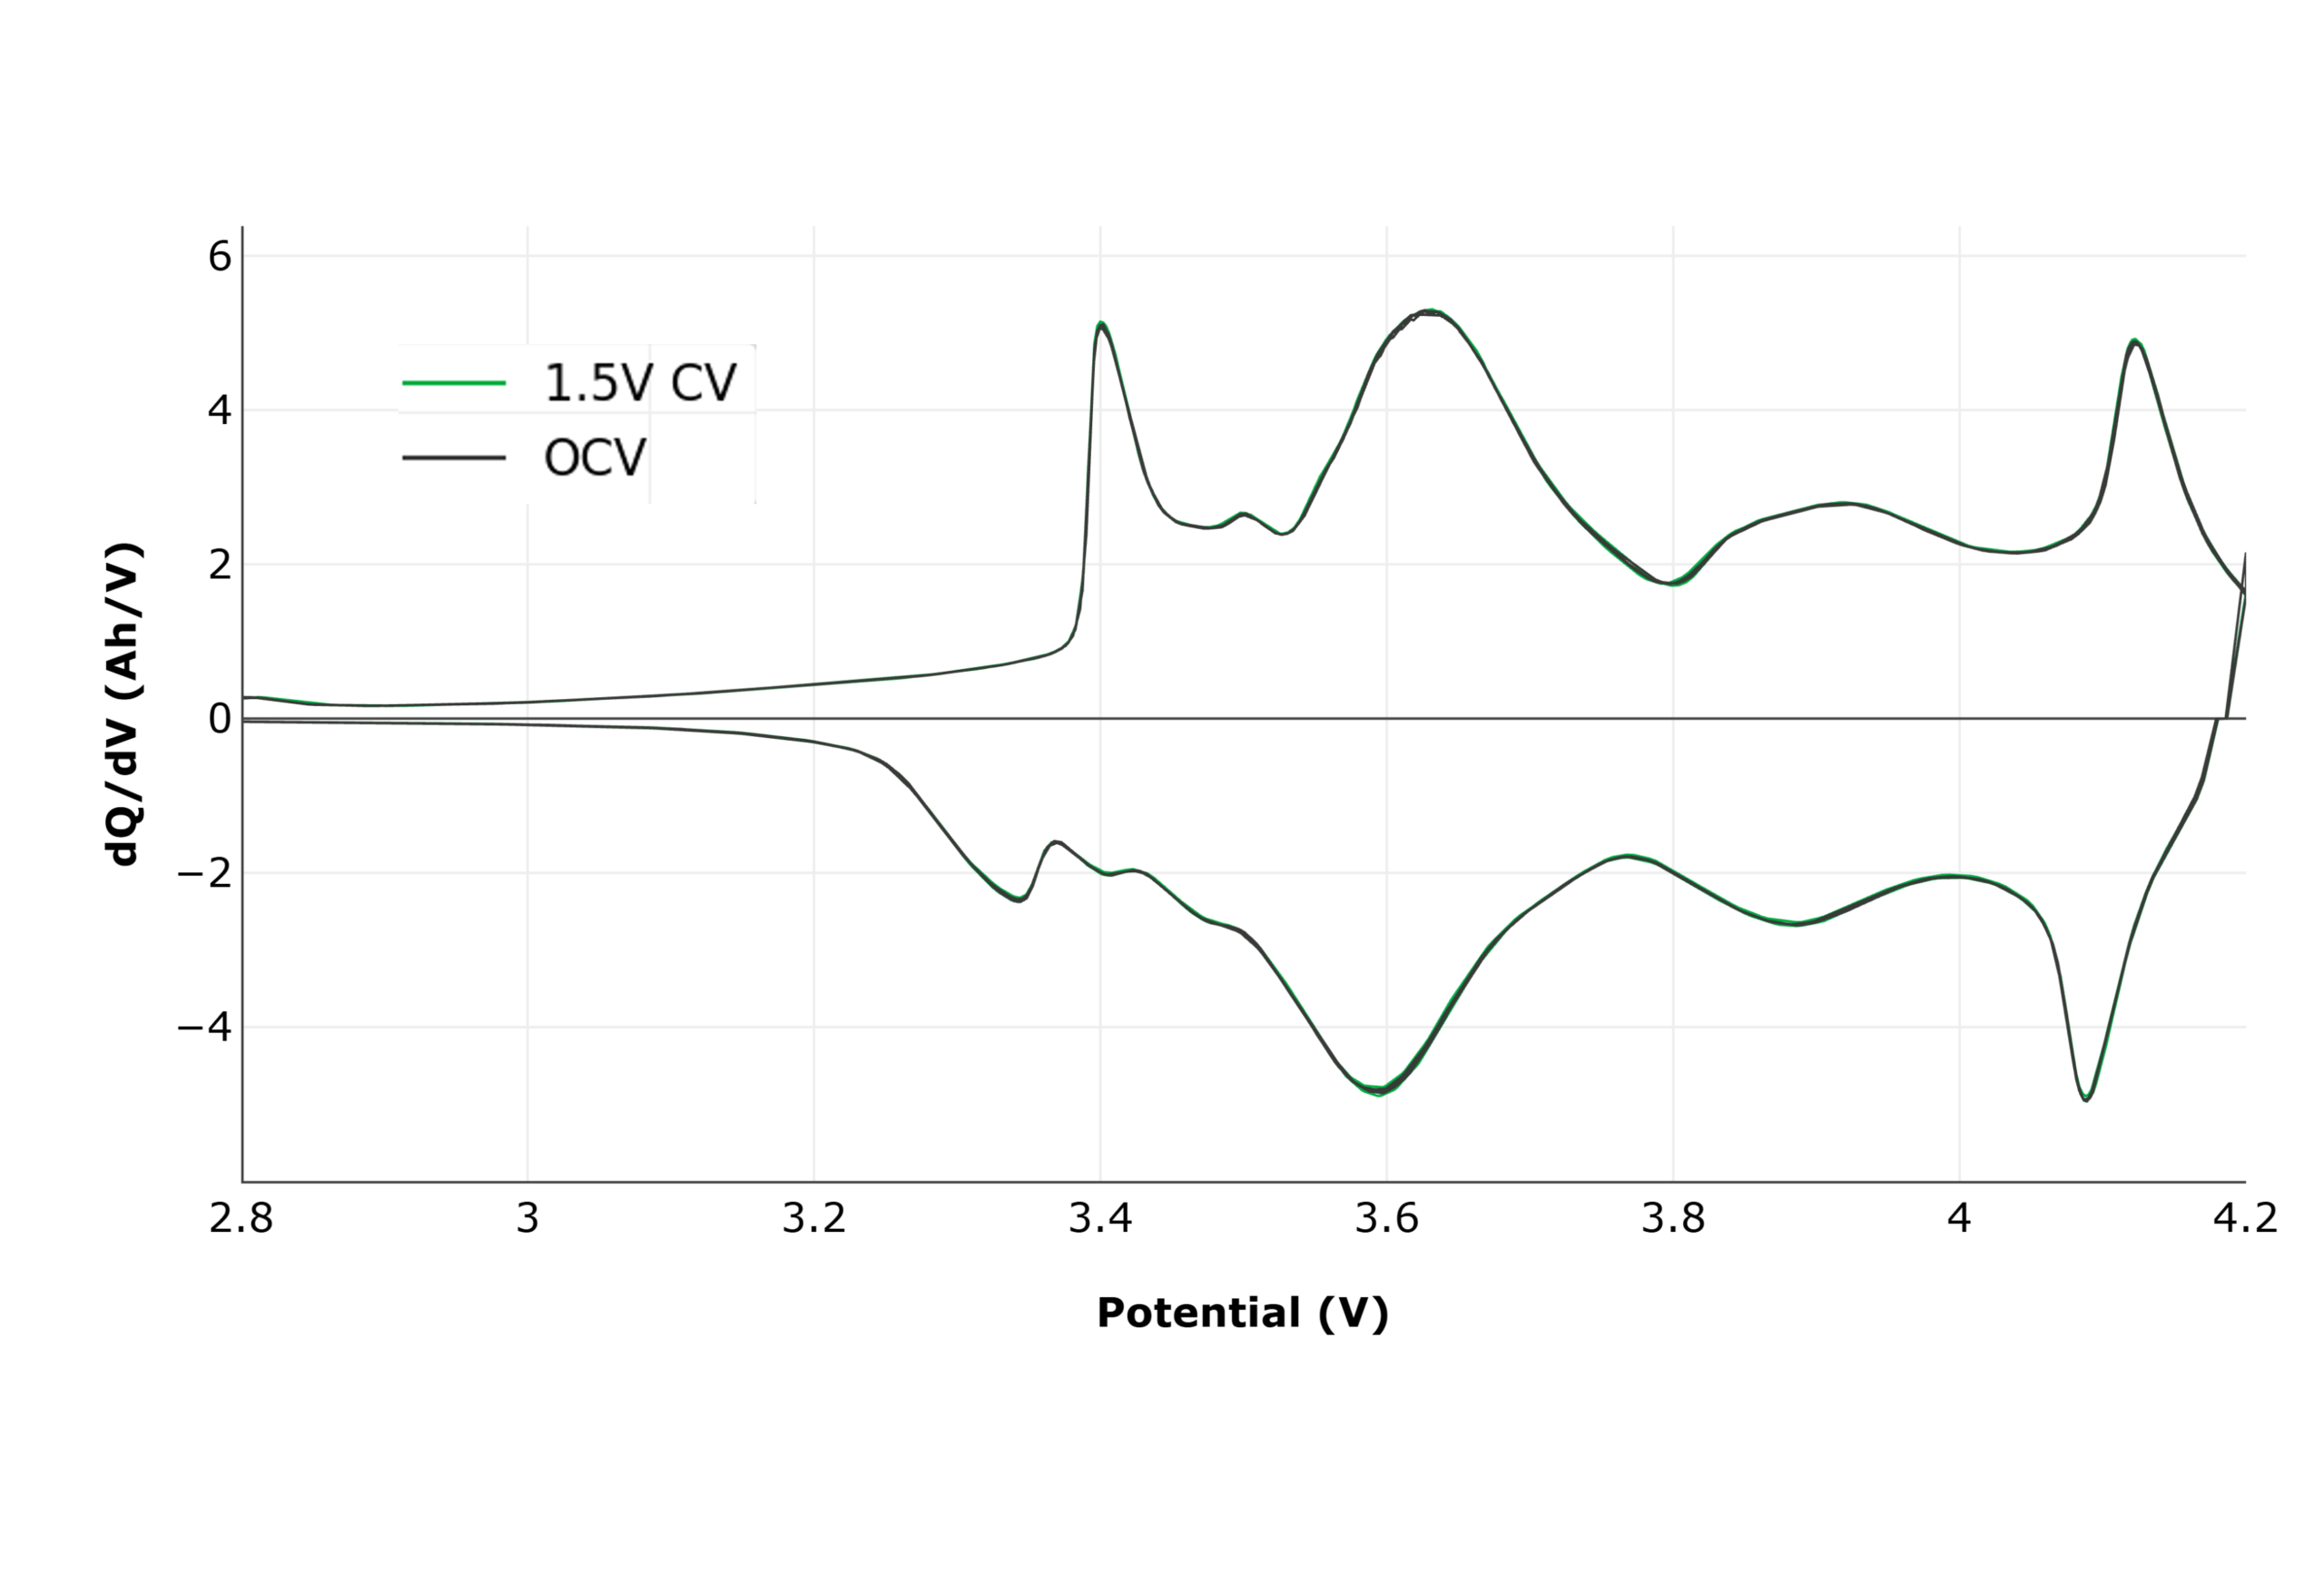
Figure 7: Full cycle dQ/dV on UHPC.
Conclusions
Both wetting conditions indicate a minimum wetting time of approximately 10 hours for this specific cell design. However, wetting time is highly dependent on variables such as temperature, cell format, chemistry, electrolyte formulation, and electrode structure. In other systems, minimum wetting times may differ significantly.
Reducing wetting time by even a few hours can meaningfully increase formation throughput and reduce cost per cell in industrial manufacturing environments.